Annual Report 2018
Published 2019-02-27 at 13:32
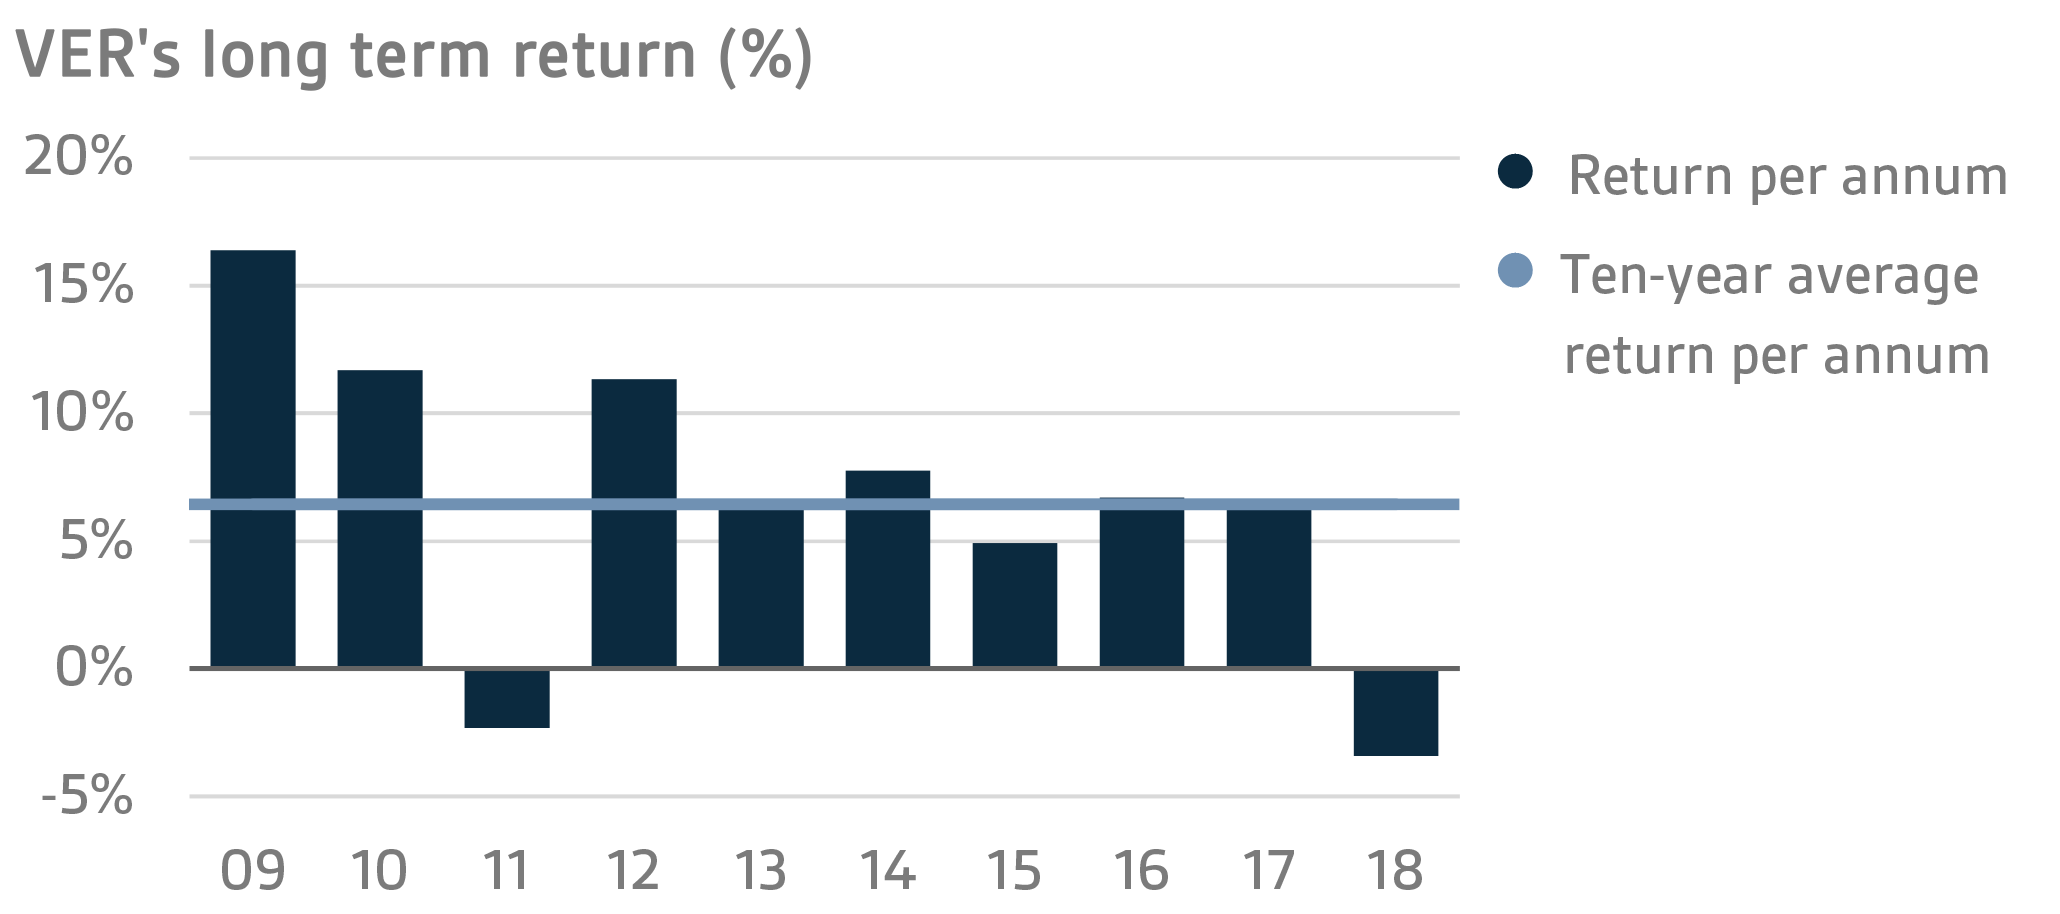
Annual return -3.4% in 2018; 10-year average return 6.4%
After several years of positive development, the economic environment began to show signs of a turn for the worse in late 2018. Economic growth slowed down in Europe and many developing countries, and the indicators for the Finnish economy started levelling off even though employment continued to improve. In the United States, the economy remained relatively vigorous and forecasts for a downturn had to be postponed repeatedly.
On the whole, the investment market put in its worst performance in years. While no collapse equivalent to the meltdowns experienced in the financial crisis ten years ago took place, returns on both equities and fixed income instruments remained negative in many areas. Given the circumstances, it is hard for an investor to avoid low returns even if the portfolios are diversified. An additional further dip in returns occurred towards the end of the year when stock markets fell in many countries. While the markets recovered quickly from the December plunge, it did not happen until 2019.
At fair values, the total return on the investments made by the State Pension Fund of Finland (VER) in 2018 was -3.4 per cent. VER’s average rate of return was 4.4 per cent for the past five years and 6.4 per cent for the past 10 years.
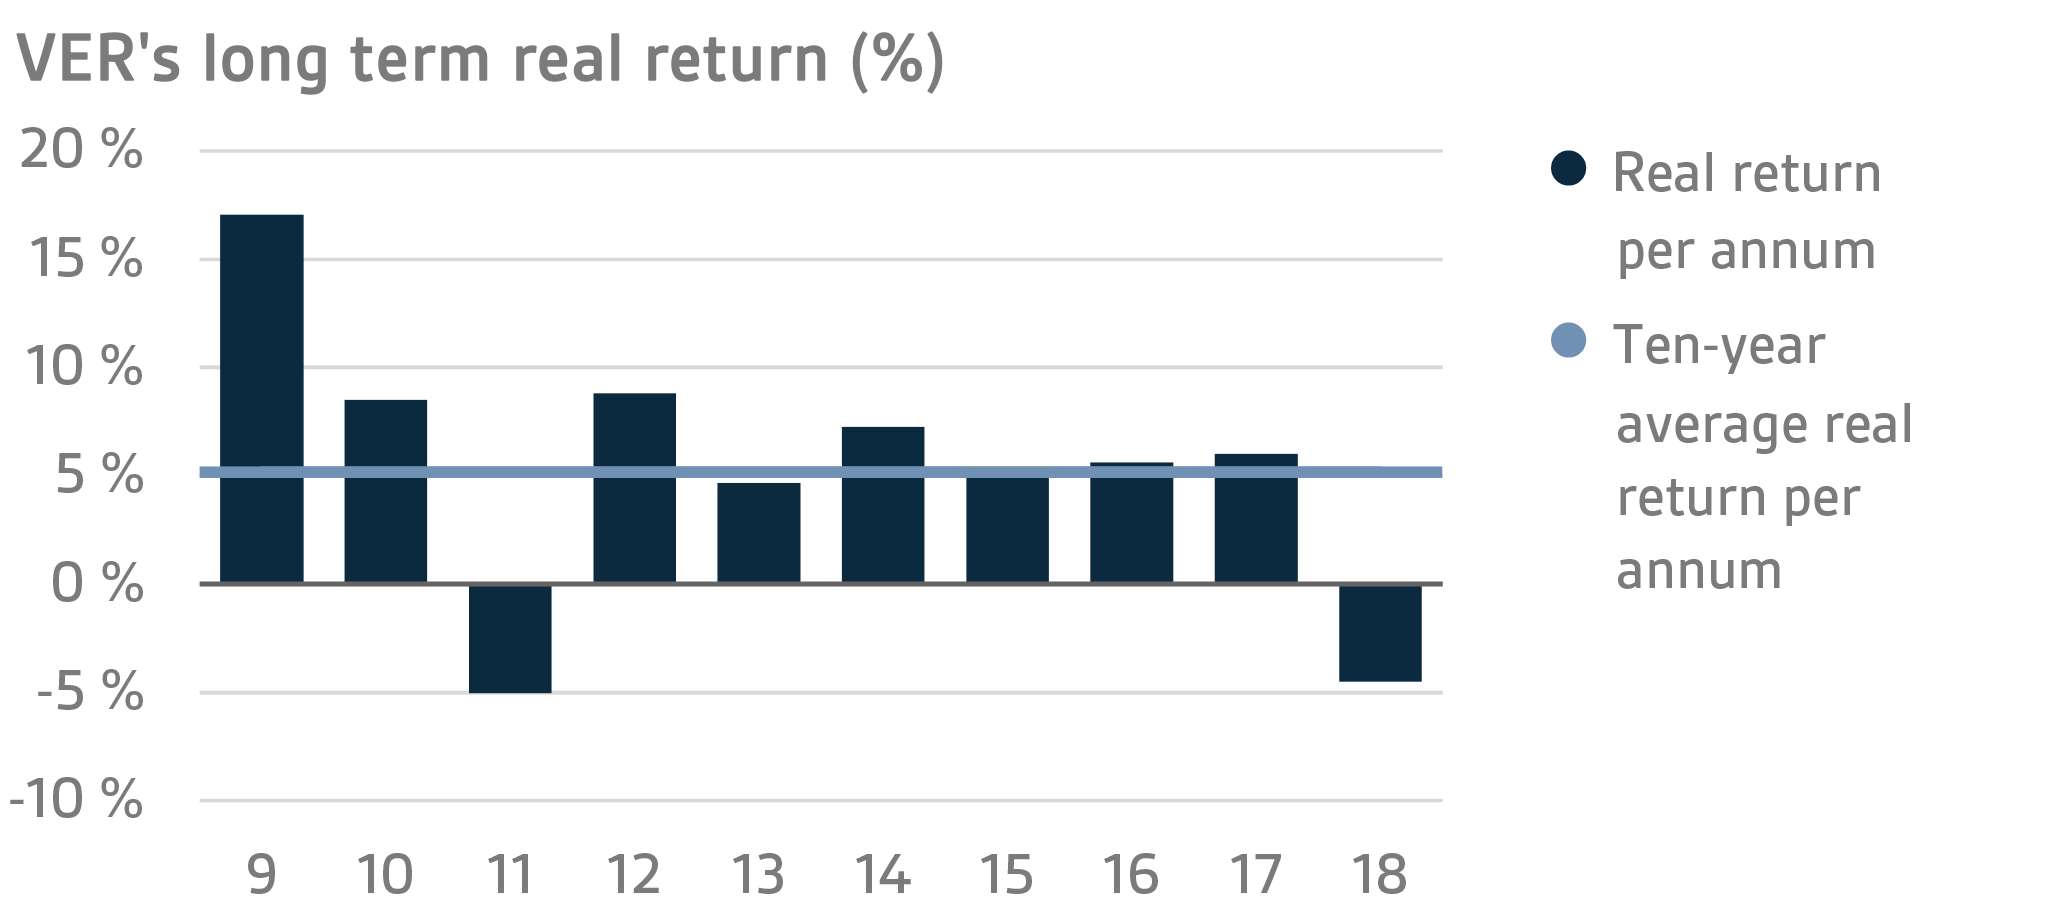
The real rate of return during 2018 was -4.5 per cent. VER’s five-year average real return was 3.8 per cent and 10-year real return 5.2 per cent. The ten-year average real return exceeds the estimates used in long-term financing calculations by a wide margin.
According to the objective established by the Ministry of Finance, VER’s long-term return must exceed the average cost of net government debt. Over the past ten years, VER’s average market value weighted rate of return has exceeded the cost of net government debt by 4.5 percentage points. Since 2001 when VER’s operations assumed their current form, the total returns earned by VER have exceeded the average cost of government debt by over EUR 5 billion.
Of the large asset classes, liquid fixed income instruments generated a return of -1.9 per cent and listed equities -7.4 per cent in 2018. The best return was earned on investments in private equity funds (13.4%). Both listed and unlisted real estate investment trusts and infrastructure funds returned slightly over 11 per cent.
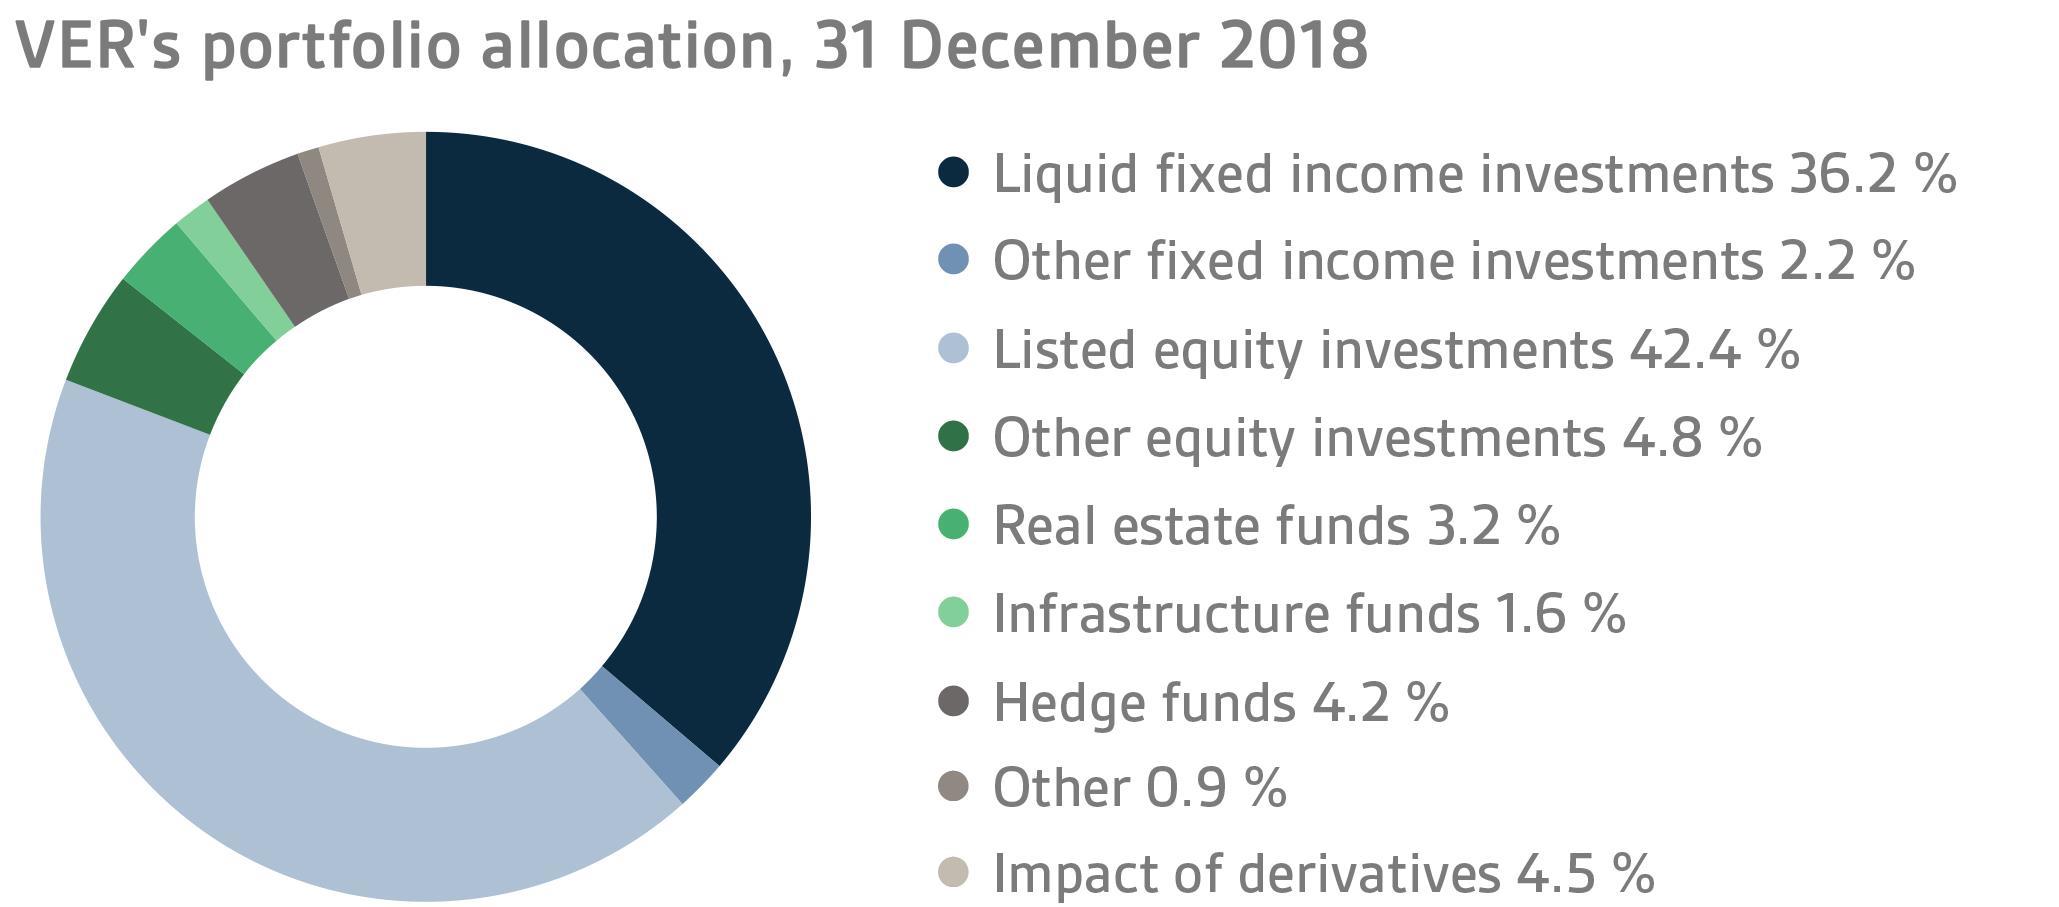
At the end of 2018, the market value of VER’s investment assets stood at EUR 18.5 billion. Of all the investments, fixed income instruments accounted for 38.4 per cent, equities 47.2 per cent and other investments 9.9 per cent of the total. The rest of the effect of risk-adjusted allocation was due to derivatives.
FIXED INCOME INVESTMENTS
Liquid fixed income investments
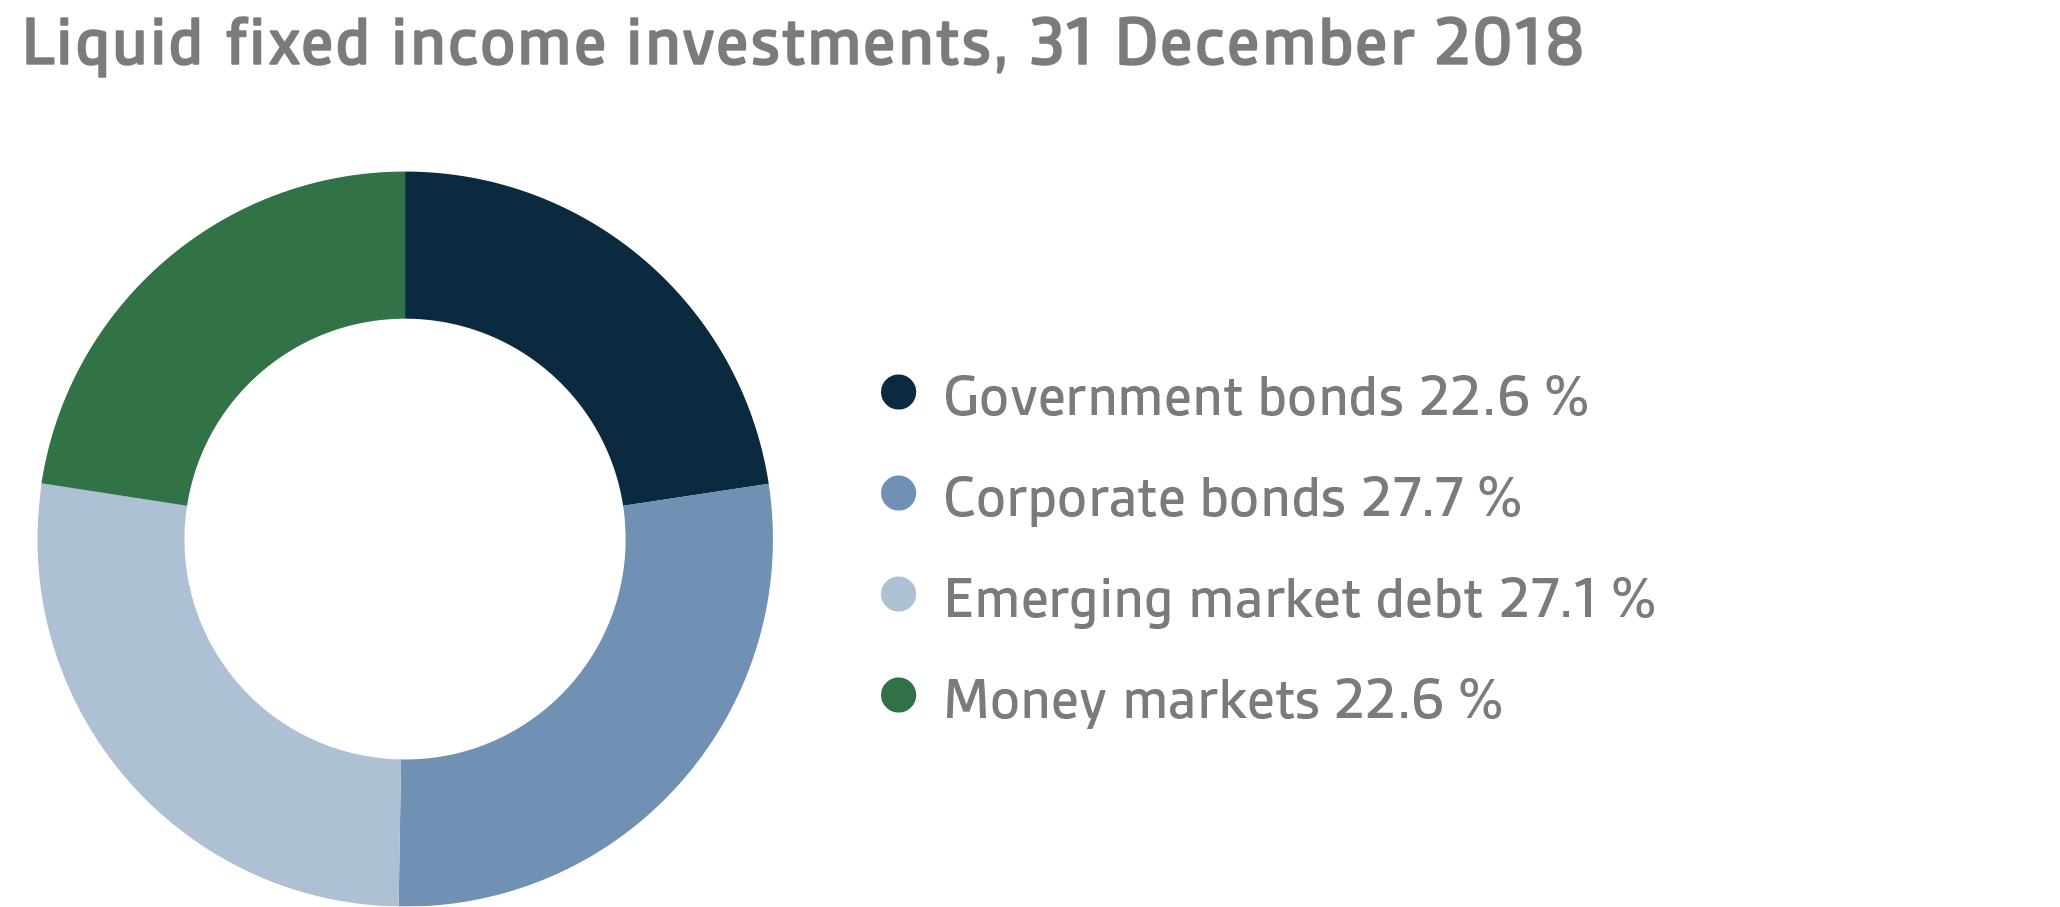
In 2018, the liquid fixed income portfolio returned -1.9 per cent and its risk-adjusted market value at the end of the year stood at EUR 6.7 billion. The duration of the fixed income portfolio remained shorter than the neutral duration of the portfolio for the entire year.
During the first few months of the year, the interest rates increased sharply as investors expected inflation to accelerate, particularly in the United States following the tax cuts, and central banks to continue to tighten their monetary policies. The risk premiums on corporate loans increased clearly from the previously extremely low levels. The emerging markets suffered as a result of raised U.S. interest rates and the stronger dollar. Additionally, fears of a trade war rattled the markets.
From early summer 2018, interest rates in Europe were affected by the political situation in Italy and suspicions of a deficit budget. The sharp increase in interest rates on Italian government bonds caused investors to seek a safe haven in German government papers. The European Central Bank’s decision to continue its monthly net asset purchases with EUR 15 billion from September to December, and the message that the benchmark rates will remain unchanged at least until autumn 2019, eased tensions in the interest rate swap markets.
In August, the problems in Turkey were extensively reflected in the emerging markets. Countries with current account and budget deficits were hit the hardest. Towards the end of the year, there was a corrective reversal that supported the fixed income markets in the emerging economies when expectations of interest rate hikes by the U.S. Federal Reserve were alleviated. The markets no longer anticipated any further rate increases by the Federal Reserve in 2019. The U.S. interest rate curve levelled off considerably.
As a result of the uncertainty created by the trade dispute between the United States and China, bleaker economic prospects and strong equity sales at the end of the year, risk aversion increased in the fixed income market, which supported U.S. and German government bonds and increased the risk premiums on corporate loans. After mid-November, the interest rates on Italian government bonds started falling sharply after the budget deficit was pressed down to a level acceptable to the European Commission.
Because of the problems experienced by the emerging economies and wider risk premiums on corporate loans, the best return on VER’s liquid fixed income instruments was generated by money market investments and European government bonds.
At the end of the year, direct investments accounted for 55.0 (59.0) per cent of the entire liquid fixed income portfolio. At the end of 2018, fixed income investments were held in 315 (271) debt instruments and fund units in 43 (42) funds.
Other fixed income investments
VER’s other fixed income investments include investments in private credit funds and direct non-liquid lending to companies. Most private credit funds are private equity funds that invest in non-liquid loans.
Towards the end of 2018, concerns intensified about a market correction in the non-liquid loan market. The rise in debt ratios that had continued for a couple of years, combined with bleaker economic prospects, augmented the risk of a forthcoming correction.
The annual return on other fixed income investments in 2018 was 8.4 (7.3) per cent. The return on private credit funds was 12.4 per cent (TWR) while infrastructure investments yielded 3.8 per cent (TWR). During the reporting period, investments (EUR 185 million) were made in four new funds. Unfunded commitments at the end of 2018 totalled EUR 356 (241) million. VER extended direct loans to two portfolio companies.
At the end of the year, the weighting of other investments in the portfolio was 2.2 (1.0) per cent.
EQUITIES
Listed equities
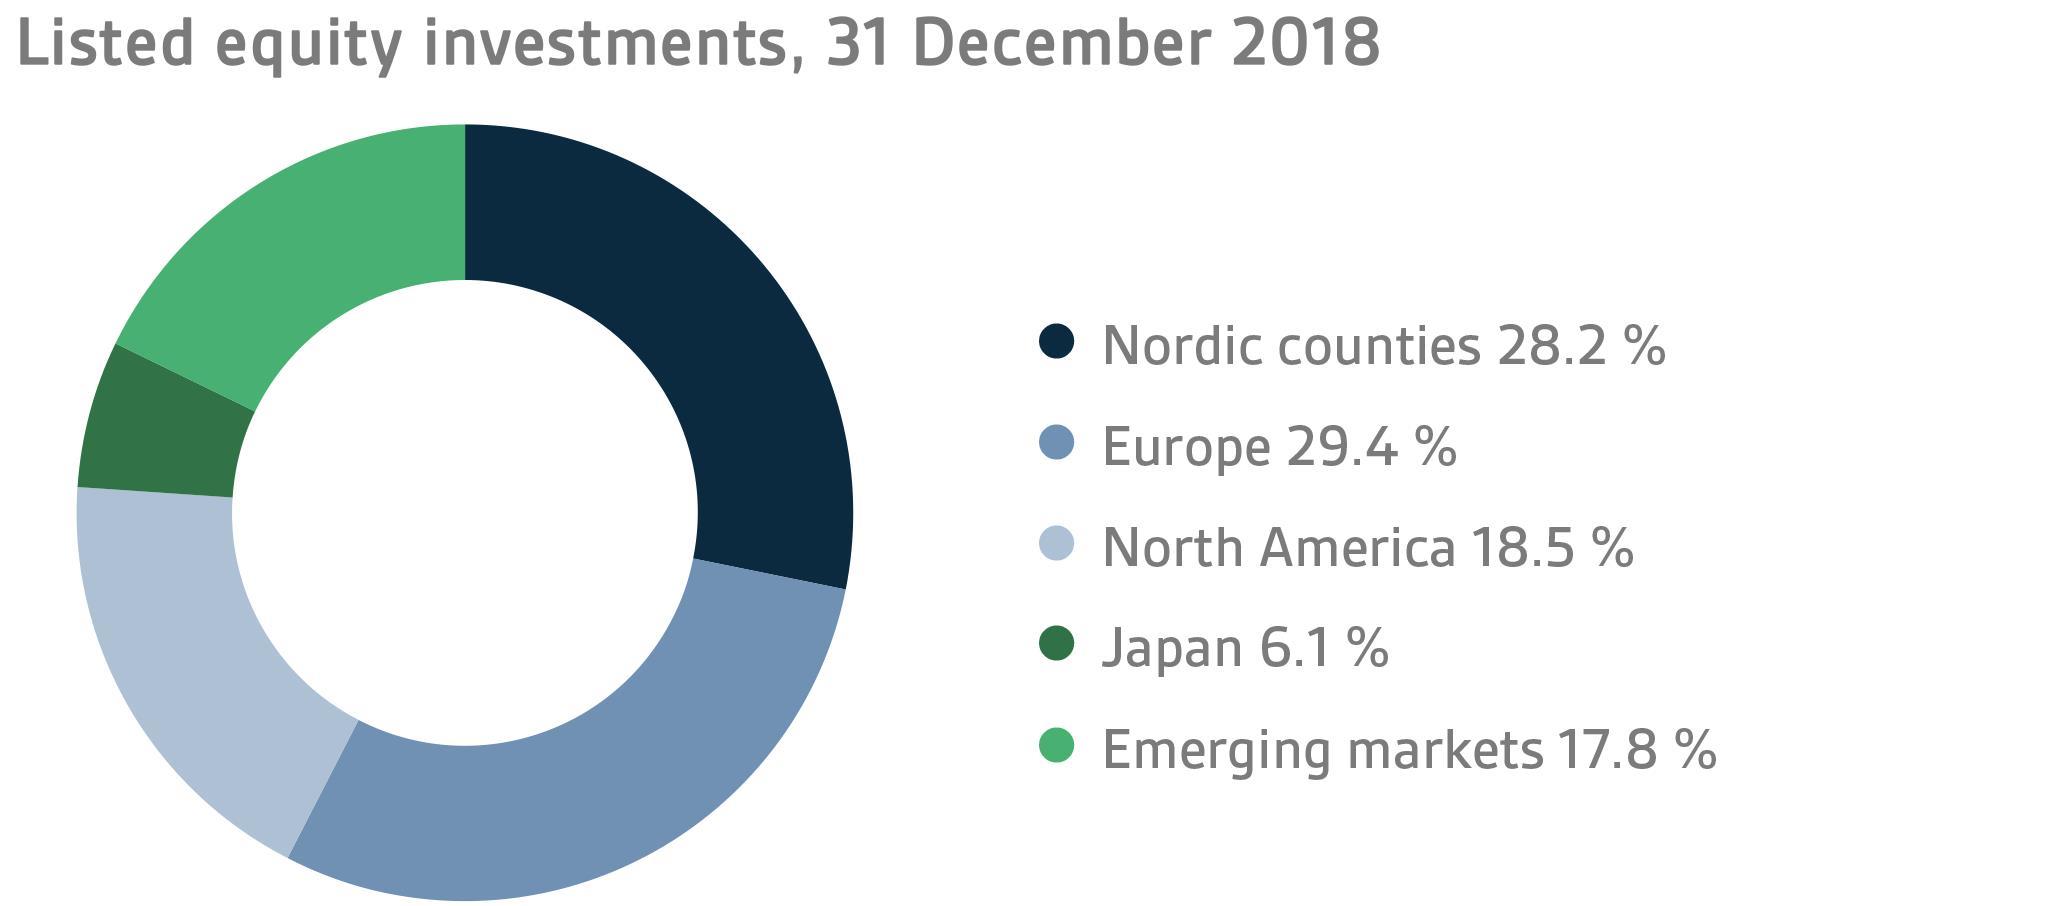
On the whole, 2018 was a poor year for equity investors. While the first three quarters were still reasonably good, a fall in share prices was evident across the board in the last quarter. By the end of 2018, the return on VER’s portfolio of listed equities and fund units reached -7.5 (11.0) per cent. The yields on all equity portfolios were in the red at the end of the year.
For VER, 2018 was the first year since 2011 when the return on equities remained negative. The mood at the beginning of the year was still fairly upbeat, but nervousness clearly began to increase in the financial market in the autumn. While the trade dispute between the United States and China had been creating uncertainty throughout the year, the situation was further aggravated in the autumn. Additionally, long-term U.S. interest rates started rising sharply in September, which only made the markets more jittery. Consequently, a clear fall in prices was witnessed across the board in the global stock markets. Although the markets recovered slightly in November, December was again a very weak month, which resulted in negative returns for the whole year.
The figures posted by listed companies continued to increase in 2018, very much in keeping with the forecasts. As a result of the decline in stock prices at the end of the year, valuation levels also became more moderate because the forecasts for the next few years were largely unaffected. However, it appears highly likely that if no solution is found to the trade dispute between the United States and China, the overall impact on global economic growth will be negative in the coming years and also eat into the profits of listed companies.
In terms of market capitalisation, the value of the equity portfolio fell from EUR 8.6 billion at the beginning of the year to EUR 7.8 billion at the end. At the end of 2018, direct equity investments accounted for 27.0 (28.5) per cent and fund investments for 73.0 (71.5) per cent of the total. At the same point of time, VER held direct interests in 102 (103) companies and units in 67 (59) funds.
Other equity investments
At the end of the reporting period, VER’s other equity investments included investments in private equity funds, non-listed stock and listed real estate investment trusts (REIT). At the end of the year, other equity investments in the portfolio accounted for 4.8 (3.7) per cent of the total.
For private equity funds, 2018 was a good year even though equity markets performed weakly. The healthy returns were due to successful exits at sound valuation levels and the continued positive financial performance of companies. At the end of the year, the yield on private equity funds was 13.4 (16.1) per cent. During the reporting period, commitments (approx. EUR 204 million) were made to invest in four new funds. At the end of the year, unfunded commitments totalled EUR 596 (500) million.
Equity investments in unlisted companies included major investments in four companies. The annual return on unlisted equities in 2018 was 7.3 (23.6) per cent.
As in the case of equities, the return on listed REITs was negative. At the end of the year, the rate of return was -9.6 (TWR) per cent.
OTHER INVESTMENTS
VER’s other investments are in real asset funds (real estate and infrastructure funds) as well as hedge funds and risk premium strategies.
As in the previous years, the real estate market continued to develop favourably, particularly in Europe. The return on real estate investments (inclusive of the return on listed real estate investment trusts) reached 5.1 (7.4) per cent. The return on unlisted real estate funds was 11.1 (TWR) per cent. Two new investments (EUR 125 million) were made in funds, while unfunded commitments at the end of the year totalled EUR 419 (365) million.
The return on infrastructure investments remained sound as a result of excellent exits from older funds and sizeable dividends. The all-year return reached 11.2 (14.8) per cent. An investment (approx. EUR 80 million) was made in one new fund during the reporting period. At the end of the year, unfunded commitments totalled EUR 254 (241) million.
Hedge funds gave a return of -2.5 (4.8) per cent in 2018. The return was unaffected by the equity sales in the markets, and if the cost of hedging the U.S. dollar is taken into account, the return for the entire year remained even slightly positive. For quantitative hedge funds the year was challenging, whereas macro and volatility funds gave a healthy return.
The return on risk premiums reached -10.3 (1.4) per cent in 2018. For risk premium strategies, the year was difficult. In particular, the return on value strategies was poor in the absence of the usual balancing effect of momentum strategies. The correlation with conventional asset classes remained low.
At the end of 2018, the market capitalisation of other investments was EUR 1,860 (1,860) million accounting for 9.9 (9.5) per cent of VER’s portfolio. Of the assets invested, real estate investment trusts accounted for 3.2 (3.1), infrastructure investments 1.6 (1.2), hedge funds 4.2 (3.6) and risk premiums 0.9 (1.5) percentage points.
Responsible investing
VER’s policy of responsible investing is outlined in the principles of responsible investing adopted by VER’s Board of Directors in 2016. For VER, responsible investing means a close and consistent evaluation of investor responsibility. It includes monitoring the responsibility and sustainable development performance of portfolio companies, and a dialogue on related activities with companies and external fund managers.
VER’s responsible investing policies are based on the UN Principles for Responsible Investment (UNPRI) and the UN Global Compact. Another objective is to achieve full transparency of responsibility in VER’s investment activities in all asset classes.
VER is aware of the importance of slowing down climate change and the need to measure, report and reduce carbon footprints. VER has been measuring the carbon footprint of companies in which it holds direct interests since 2015. The footprint for 2018 will be calculated during 2019. During the reporting period, VER expanded its awareness of the responsibility of its direct equity investments by measuring their ESG scores and positive environmental impact.
VER pursues a policy of responsible investment in all asset classes. However, actual policy implementation may vary according to asset class because the latitude available for the application of the underlying principles varies. At numerous meetings with fund and company representatives, VER has addressed ESG issues and taken active part in the meetings of shareholders of Finnish portfolio companies.
The state’s pension expenditure continues to increase
The State Pension Fund’s role in balancing government finances has grown and will continue to do so. In 2018, the state’s pension expenditure totalled over EUR 4.6 billion. As VER contributes 40 per cent towards these expenses to the government budget, the transfer to the 2018 budget amounted to almost EUR 1.9 billion. Over the same period, VER received approximately EUR 1.4 billion in pension contributions. Its net pension contribution income has now turned permanently negative, meaning that more money is transferred from the Fund to the government budget than VER receives in pension contribution income. This gap between income and budget transfers will continue to grow year on year.
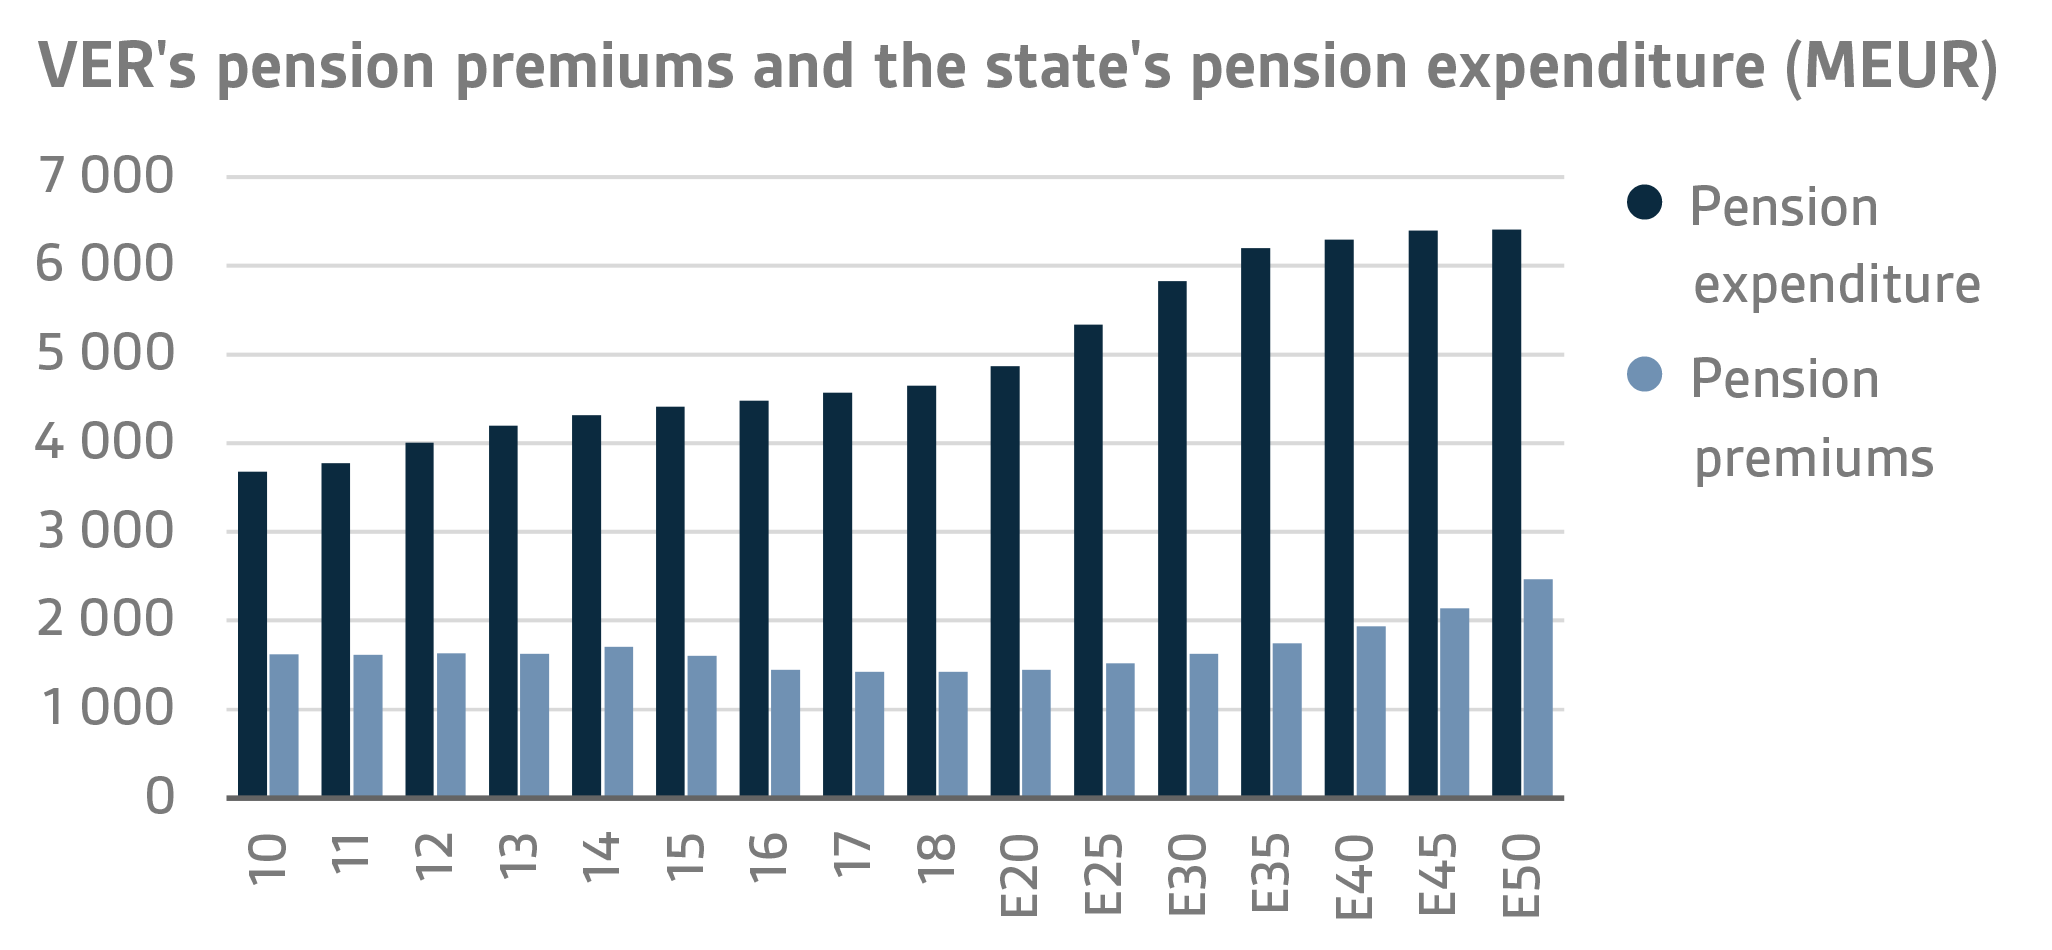
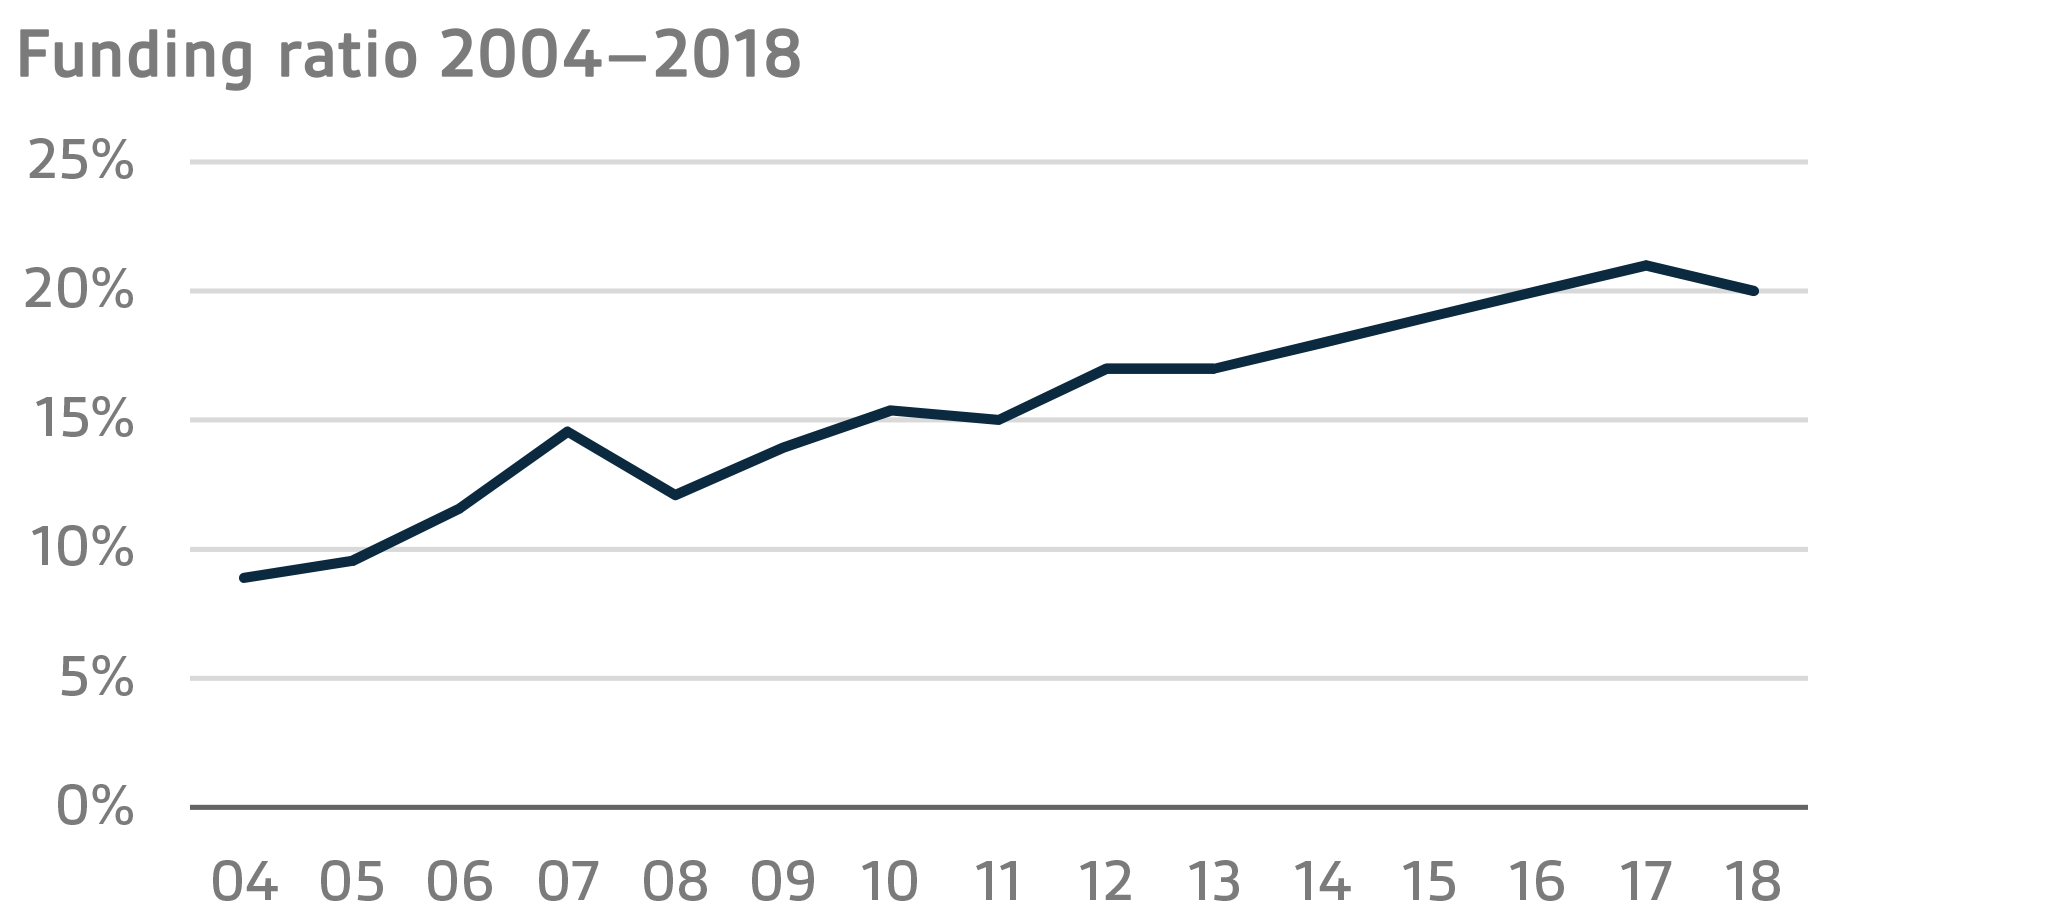
In June 2016, the Board of Directors of the State Pension Fund adopted a strategy that defines its long-term objectives in greater detail. The strategy foresees that the 25 per cent funding ratio target specified by law will be attained by 2033, if not earlier. To achieve this, it is imperative that VER’s pension contribution income remains at the estimated level and that the real return on investments remains relatively high. As the state’s pension liabilities amounted to EUR 92.1 billion at the end of 2018, the funding ratio was approx. 20 per cent. Additionally, the strategy sets out the principles by which the risk level and basic allocation of the investment portfolio are derived from the target funding ratio established for VER, with due regard to the long-term target return defined by the Ministry of Finance.
VER’s administration
VER, established in 1990, is an off-budget entity. VER is an investment organisation with a mission to manage the assets entrusted to it. The collection of pension contributions to the state pension system and related duties, like the processing of pension applications and payment of pensions, are handled by the Local Government Pension Institution Keva. VER pays Keva a management fee for these services, which in 2018 amounted to about EUR 16.9 million.
The responsibility for oversight and control of VER’s operations rests with the Ministry of Finance, which is authorised to issue general instructions regarding the organisation of VER’s administration, financial management and the investment of its assets. According to standing instructions, fixed income instruments must account for a minimum of 35 per cent, equities for no more than 55 per cent, and other investments for no more than 12 per cent of the market capitalisation of the portfolio. Under the same rules, real estate investments must consist of fund investments or equivalent indirect investments.
VER’s Board of Directors is appointed by the Ministry of Finance. The Board has seven members, three of whom are appointed from candidates proposed by government staff organisations. The Chair of the Board of Directors is Jukka Pekkarinen and the Chair of the Investment Advisory Committee Eva Liljeblom up until 30 September 2018 and Jussi Laitinen since 1 October 2018.
In 2018, VER’s operating costs amounted to EUR 7.1 million, which represents 0.04 per cent of the average annual capital. At the end of the year, VER had 24 employees. The Managing Director is Timo Viherkenttä. VER invests in human resources by maintaining and developing the professional skills of the staff, which is important both in seeking maximum returns on investments and in managing risks.
Key figures 2018
|
|
2018
|
2017
|
|
Return on investments, %
|
-3,4 %
|
6,6 %
|
|
Real return, %
|
-4,5 %
|
6,0 %
|
|
|
|
|
|
RETURN BY ASSET CLASS, %
|
|
|
|
Fixed income investments
|
|
|
|
Liquid fixed income investments
|
-1,9 %
|
2,0 %
|
|
Other fixed income investments
|
8,4 %
|
7,3 %
|
|
Equities
|
|
|
|
Listed equities
|
-7,4 %
|
11,0 %
|
|
Other equity investments (TWR)
|
4,9 %
|
15,6 %
|
|
Other investments
|
|
|
|
Unlisted real estate funds (TWR)
|
11,1 %
|
7,1 %
|
|
Infrastructure funds
|
11,2 %
|
14,8 %
|
|
Hedge funds
|
-2,5 %
|
4,8 %
|
| |
|
|
|
Expenses for investment activities (as % of average capital)
|
0,04 %
|
0,04 %
|
|
|
|
|
|
AVERAGE RETURNS
|
5 years
|
10 years
|
|
Average return on portfolio p.a.
|
4,4 %
|
6,4 %
|
|
Average real return p.a.
|
3,8 %
|
5,2 %
|
|
Average effective interest rate on government debt p.a.
|
1,4 %
|
1,9 %
|
|
|
|
|
|
PORTFOLIO ALLOCATION
|
2018
|
2017
|
|
Total investments, EURm
|
18 485,7
|
19 586,2
|
|
|
|
|
|
Fixed income investments, %
|
38,4 %
|
40,3 %
|
|
Liquid fixed income investments, %
|
36,2 %
|
39,2 %
|
|
Other fixed income investments, %
|
2,2 %
|
1,0 %
|
|
Equity investments, %
|
47,2 %
|
47,5 %
|
|
Listed equities, %
|
42,4 %
|
43,8 %
|
|
Other equity investments, %
|
4,8 %
|
3,7 %
|
|
Other investments, %
|
9,9 %
|
9,5 %
|
|
Unlisted real estate funds, %
|
3,2 %
|
3,1 %
|
|
Infrastructure funds, %
|
1,6 %
|
1,2 %
|
|
Hedge funds, %
|
4,2 %
|
3,6 %
|
|
Other, %
|
0,9 %
|
1,5 %
|
|
|
|
|
|
KEY FIGURES
|
2018
|
2017
|
|
Volatility
|
6,2 %
|
3,3 %
|
|
Sharpe ratio
|
-0,5
|
2,1
|
|
|
|
|
|
OTHER KEY FIGURES
|
2018
|
2017
|
|
Pension contribution income, EURm
|
1 425
|
1 427
|
|
Budget transfers, EURm
|
1 859
|
1 827
|
|
Net contribution income, EURm
|
-434
|
-401
|
|
Balance sheet total, EURm
|
15 406
|
15 319
|
|
Pension liabilities, EUR bn
|
92,1
|
92,6
|
|
Funding ratio, %
|
20 %
|
21 %
|
Inquiries:
CEO Timo Viherkenttä, firstname.lastname@ver.fi, tel.: +358 (0)295 201 210
Established in 1990, the State Pension Fund (VER) is an off-budget fund through which the state prepares to finance future pensions and equalise pension expenditure. VER is an investment organisation responsible for investing the state’s pension assets professionally. At the end of 2018, the market value of the Fund’s investment portfolio stood at EUR 18.5 billion.