2015 Annual Financial Report of the State Pension Fund
Published 2016-02-29 at 12:39
Return on investment activities
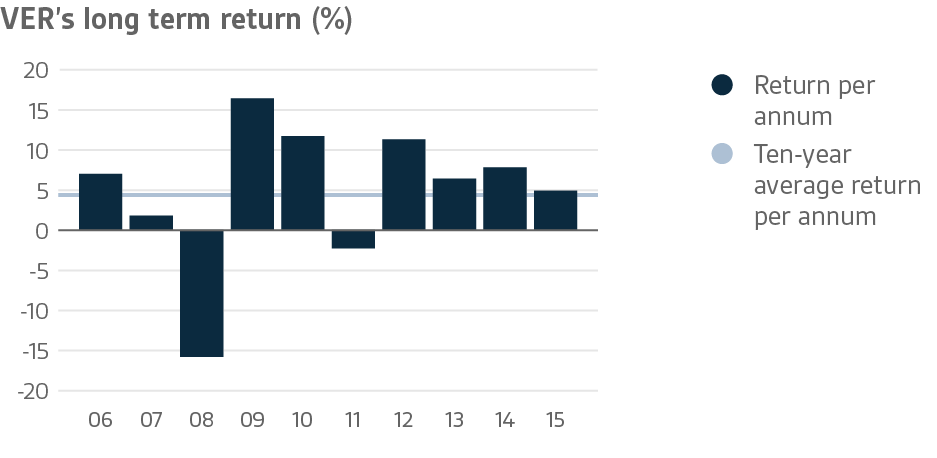
The total return on the investments made by the State Pension Fund (VER) in 2015 was 4.9 per cent. Given the slightly negative rate of inflation, the real return was 5.1 per cent, which exceeds the long-term average expected return in the pension insurance sector. Considering the fluctuations and volatility of the markets, the overall performance was good.
All the asset classes yielded a positive return in 2015. Of the large assets classes, liquid fixed-income instruments generated a return of 0.2 per cent and listed equities 10.3 per cent. Of the other investments, the best return was yielded by private equity funds at 18.6 per cent. Similarly, the returns from private equity, infrastructure, real estate and private credit funds were highly satisfactory.
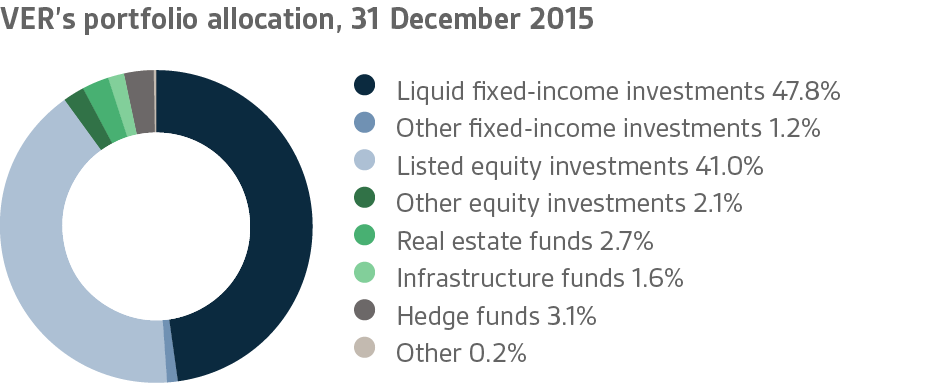
At the end of 2015, the market value of the Fund’s portfolio stood at EUR 17.9 billion (EUR 17.6 billion in 2014). Of this, fixed income investments accounted for 49.0 (51.5) per cent, equity investments for 43.1 (42.2) per cent and other investments for 7.5 (6.6) per cent. The increase in the managed assets was limited by the additional EUR 500 million that VER was required to contribute towards the 2015 government budget under a one-year exceptional law.
The average nominal return over the past five years is 5.5 per cent and real return 4.0 per cent. The ten-year nominal averages are 4.5 and 2.7 per cent, respectively.
In 2015, the investment markets were affected by the actions of the central banks. The anticipation for and actual implementation of the increase in the U.S. interest rate by the Federal Reserve and the reflationary monetary policy pursued by the Bank of Japan greatly influenced investor behaviour. Fluctuations in the equity and fixed-income markets and movements in commodity prices and even exchange rates were considerable throughout the year.
In the real economy, the operating environment was variable in 2015. Economic growth slowed down in many of the emerging economies that had previously played key roles in the world, notably China. Some questions also arose in the U.S. economy whereas growth in Western Europe was more vigorous than in the previous years. Failing to keep up with mainland Europe, the Finnish economy experienced the fourth weak year running.
Fixed income instruments
Liquid fixed-income investments
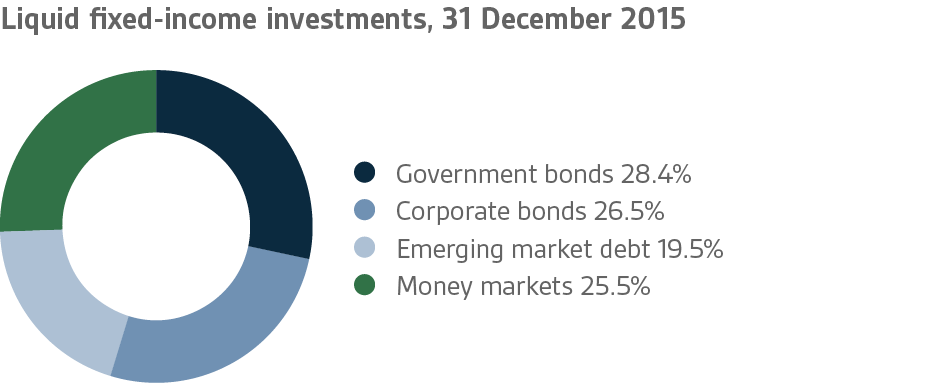
In 2015, the liquid fixed-income portfolio returned 0.2 per cent and its market value at the end of the year stood at EUR 8.6 billion. The duration of the fixed-income portfolio remained shorter than the neutral duration of the portfolio for the entire year.
While the economic prospects for Europe improved slightly in early 2015, the markets were concerned about the developments in Greece that came to a head in the summer. As the situation in Greece receded into the background, the third quarter was characterised by expectations of a series of rate increases by the U.S. Federal Reserve (FED) on the one hand and fears of stagnating growth on the other, especially in the emerging markets in the wake of China’s dimming prospects. The devaluation of the Chinese currency triggered a process in which the currencies of the emerging economies weakened considerably at the same time as interest rates went up. The interest and currency volatility of these economies remained high up to the end of the year.
During the last quarter, the monetary policies of the FED and European Central Bank diverged considerably when the ECB cut its deposit rate by 10 basis points to minus 0.30 per cent, and the asset purchase programme was continued at least up to the end of March 2017. At the same time, the FED raised the U.S. interest rate by 0.25 per cent. As the markets had expected a more accommodative monetary policy, the interest rates in the euro area increased clearly.
Of the liquid fixed-income instruments, government bonds performed the best. All the sub-portfolios generated a positive return except for emerging market debt where fixed-income investments denominated in local currencies suffered from the movement in interest rates and the strong depreciation of the currencies. During the reporting period, the money market portfolio was overweighted and investments in local currencies underweighted. A more or less neutral allocation was maintained in respect of corporate and government bonds.
At the end of the reporting period, direct investments accounted for 65.5 (73.0) per cent of the entire liquid fixed-income portfolio. At the end of the year, direct fixed-income investments were held in 296 (199) debt instruments and fund units in 36 (34) funds.
Other fixed-income investments
VER’s other fixed-income investments consist of investments in private credit funds. Most of the funds in the portfolio are private equity type funds investing in non-liquid loans.
The market sentiment in the non-liquid loan market continued positive throughout 2015. As the banks were still unwilling to finance small and medium-sized enterprises, more room was left for private funding. The return on the portfolio in 2015 was 7.1 per cent (TWR in 2014 being 5.1 per cent) exceeding the target return. During the reporting period, investments were made in two new funds. At the end of the year, the weighting of private credit investments in the portfolio was 1.2 (0.8) per cent. Unfunded commitments totalled EUR 121 (145) million at year-end.
Equities
Listed equities
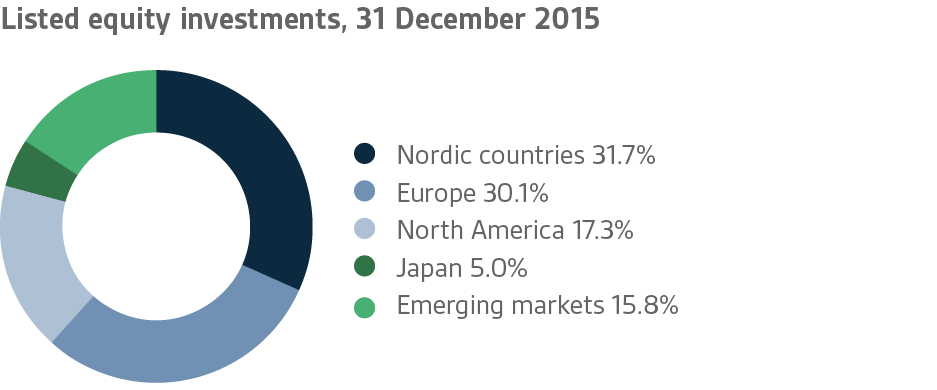
The return on VER’s portfolio of listed equities and ETFs fluctuated exceptionally violently during 2015. However, the overall return at the end of the year was clearly positive at 10.3 (11.7) per cent. All the equity portfolios showed a return at the end of the year, except for the emerging markets. The total net worth of the stocks and shares sold during the year was EUR 325 million. At the end of the year, listed equities accounted for 41.0 per cent of the investment portfolio.
The stock markets seesawed on a grand scale during 2015. At the beginning of the year, the risk sentiment reached an all-time high for years and share prices soared up to the end of April. In contrast, late spring and summer was a period of greater uncertainty when fears about the slowdown of the Chinese economy were raised in the investment markets. The nervousness felt in the summer culminated in late August when China announced new currency measures, after which share prices plummeted across the word. A slow recovery followed during the autumn lasting up to early December when this market segment took another hit as a result of what were felt to be lame decisions by the ECB. All in all, December was highly restless, but by the end of the year most of the equity markets closed on a positive note.
In terms of market capitalisation, the value of the share portfolio increased from EUR 7.0 billion at the beginning of the year to EUR 7.3 billion at the end. At the end of 2015, direct equity investments accounted for 29.7 (31.2) per cent of the total of which 70.3 (68.8) per cent was invested through funds. At the end of the year, VER held direct investments in 101 (156) companies and fund units in 62 (60) funds.
Other equity investments
At the end of the reporting period, VER’s other equity investments included investments in private equity funds and non-listed shares.
For the private equity funds in VER’s portfolio, 2015 was an excellent year. By the end of the year, the rate of return reached 18.6 per cent (TWR in 2014 being 12.0 per cent). Underlying the high return was the positive development of the equity market, which was reflected in increased market valuations of the portfolio companies. Another contributing factor was that older funds matured to a point allowing an exit in an atmosphere of a positive market sentiment. During the reporting period, investments were made in three new funds. Unfunded commitments totalled EUR 356 (262) million at year-end.
Non-listed equities included investments in SATO Plc and Certeum Ltd. Both companies generated healthy returns reaching 9.1 (2.4) per cent by the end of the year.
At the end of the year, equity investments in the portfolio accounted for 2.1 (2.7) per cent of the total.
Other investments
VER’s other investments include investments in hedge, infrastructure and real estate funds and risk premium strategies.
The hedge funds returned 2.5 (6.0) per cent in 2015, clearly exceeding the industry average. The portfolio strategies performed well despite the turbulent market conditions. The best return was yielded by market-neutral equity funds that succeeded in their sector allocation. During 2015, VER invested in risk premium strategies both through funds and total return swaps. As a result of successful timing, they contributed to overall returns.
Infrastructure investments generated a healthy return across the board reaching 11.7 per cent (TWR in 2014 being 3.7 per cent). No new fund investments were made in the portfolio in 2015, except that the holdings in Fingrid Oyj were rearranged by transferring them to Aino Ky, a fund established jointly by VER and two other institutions.
As in the previous year, market developments in respect of real estate investments remained positive throughout the year. Investments both in Europe and Asia generated an annual return of 9.5 (10.3) per cent. Three new investments in funds were made during the year.
At the end of the year, other investments accounted for 7.5 (6.6) per cent of VER’s portfolio. The market value of the portfolio was EUR 1,348 (1,162) million. Unfunded commitments in respect of infrastructure and real estate funds totalled EUR 284 (264) million. Of all the assets invested, hedge funds accounted for 3.1 (2.9) per cent, risk premium funds for 0.2 (0.0) per cent, real estate funds for 2.7 (2.5) per cent, and infrastructure funds for 1.6 (1.1) per cent of the total.
VER’s role in equalising pension expenditure growing
Finland’s population is ageing at a faster rate than in other western European countries. Most of the baby-boomers have retired over the past few years and pension expenditure has exceeded pension contribution income in both private and state pension systems.
The extensive pension reform adopted by Parliament in autumn 2015 will increase the retirement age for old age pensions and amend the criteria for the determination of the amount of pensions. The reform seeks to extend work careers and underpin the sustainability of both the pension system and the public finances in general. For a long time now, the criteria for the determination of pensions have been identical to those applied in the private sector and municipal systems; however, the transitional arrangements made at the time when the previous system was in place will continue to have an impact for a long time to come. In terms of factual content, the ongoing reform will also affect the individual systems in the same way.
VER’s assets are not used to pay out pensions directly; instead, all state pensions are paid out of the appropriations allocated for this purpose in the government budget. Under the Act on the State Pension Fund, an amount equivalent to 40 per cent of the state’s total pension expenditure is to be contributed to the state budget annually.
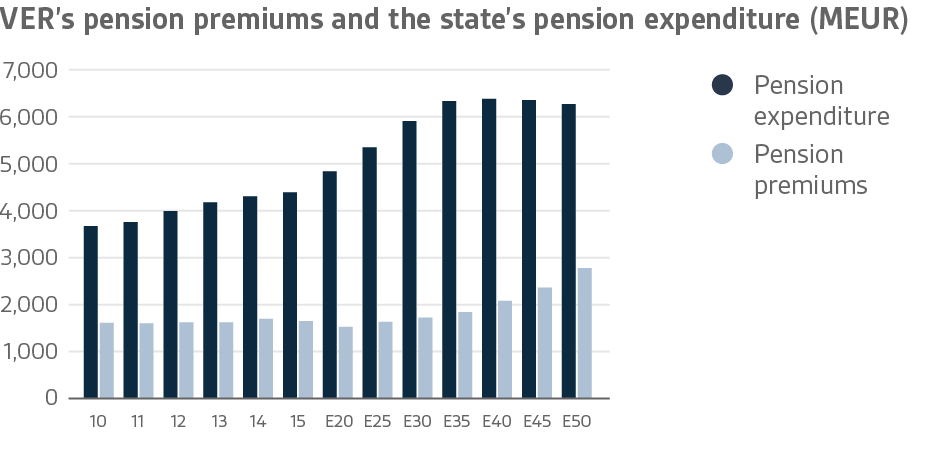
Equalising the cost burden represented by state pension expenditure has been VER’s key mission. VER will be called upon to contribute towards covering the expenditure with substantial amounts at or about the year 2030 when it peaks.
VER’s role in balancing government finances has grown and will continue to do so. Its net pension contribution income has now turned permanently negative, meaning that more money is transferred from the Fund to the government budget than what VER receives in pension contribution income. This gap between income and budget transfers will continue to grow year by year.
During the financial year, VER received pension premiums and equivalent income in the total amount of EUR 1,659.0 million, of which EUR 1,222.6 million was contributed by employers and EUR 386.6 million by employees. Additionally, VER received EUR 6.8 million in unemployment insurance premiums and EUR 43.0 million in transitional payments. The 2015 pension contribution income fell short of the 2014 level by EUR 73.4 million. This was due to the decrease in the total wage bill of the employees covered by the state pension system. The wage bill was reduced because the personnel of municipal schools and universities are gradually transferring to other pension systems. Other contributing factors include staff reductions and the reorganisation of government agencies as commercial enterprises.
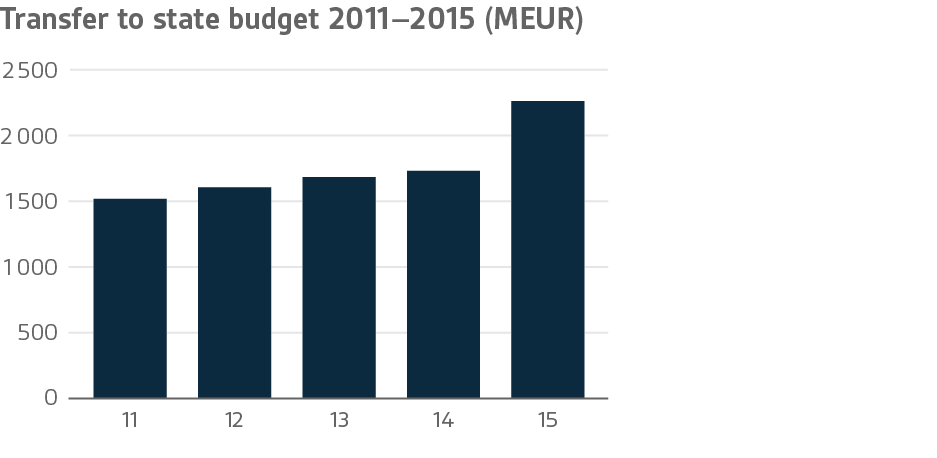
In 2015, VER transferred the record amount of EUR 2,263.4 million to the government budget inclusive of the additional EUR 500 million paid under the exceptional law. If this extra payment is excluded, the amount transferred grew by EUR 35.2 million year-on-year due to the state’s increased pension expenditure.
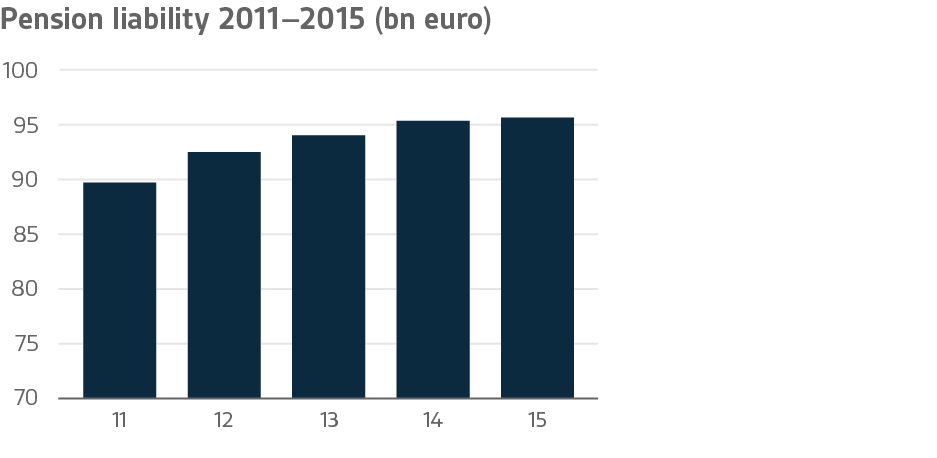
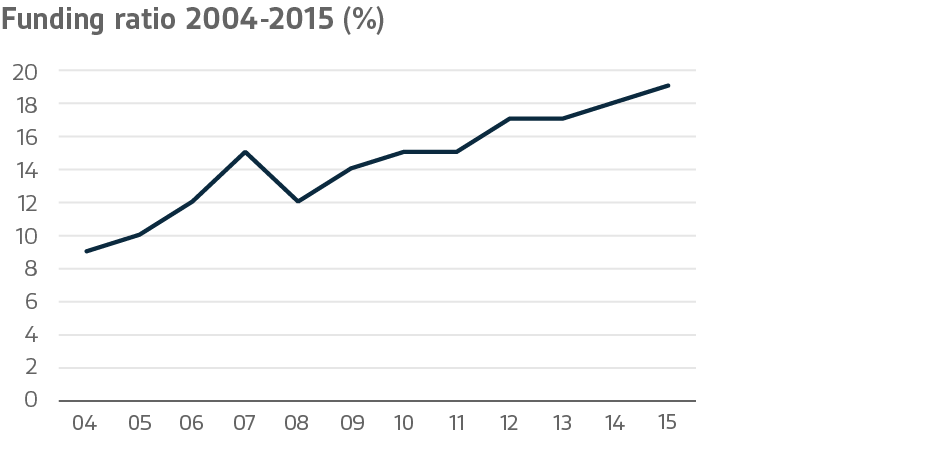
At the end of 2015, the state’s pension liabilities were EUR 95.7 billion. Under the law, VER’s target funding ratio is 25 per cent of the state’s pension liabilities. At the end of 2015, VER’s funding ratio was 19 per cent. Whether this goal is achieved or not is essentially determined by the return on investments, pension contribution income and transfers to the government budget.
Since 2013, the duties related to the collection of the state employers’ pension contributions have been discharged by the Local Government Pension Institution Keva. VER pays Keva compensation for the provision of the services assigned to Keva in the State Pension Act. In 2015, the amount of this compensation determined annually by the Ministry of Finance was EUR 21.2 million.
|
|
2015
|
2014
|
|
Pension contribution income, EURm
|
1,659
|
1,732
|
|
Net contribution income, EURm
|
-604
|
4
|
|
Budget transfers, EURm
|
2,263
|
1,728
|
|
Balance sheet total, EURm
|
14,709
|
14,715
|
|
Pension liabilities, EURm
|
95,700
|
95,400
|
|
Funding ratio, %
|
19%
|
18%
|
VER’s administration
The year 2015 marked the 15th anniversary of the establishment of the State Pension Fund. As VER has been making investments in diversified securities since 2001, the previous year was its 15th year of operation in its current form.
On 1 March 2015, the Ministry of Finance appointed VER’s new Board of Directors. Jukka Pekkarinen, PhD (Pol.Sc.), was appointed Chair of the Board. Timo Viherkenttä, PhD Law, was appointed Managing Director as of 1 June 2016. The Investment Consultative Committee was reappointed for a new three-year term as of 1 October 2015. The committee is chaired by Professor Eva Liljeblom.
Outlook
In fulfilling its mission, the State Pension Fund has reached a point where it provides tangible support toward financing state pensions in that the amount to be transferred to the government budget exceeds the pension contribution income received. Consequently, the returns from the investment activities are no longer left in the Fund because part of the earnings are needed to finance budget transfers. This will be the permanent state of affairs as pension expenditure will continue to increase at the same time as the number of employees in the system decreases.
For these reasons, among others, VER will need to take special care to ensure that the investments can be readily converted into cash when necessary. However, the overall financial outlook continues to allow VER to gradually reduce its fixed-income portfolio while increasing the percentage of investments in real estate, infrastructure, private equity, private credit and hedge funds and risk premium strategies in a controlled manner. As a result of the currently low interest rates, expected returns on fixed-income instruments over the next few years are low.
VER’s KEY FIGURES
|
|
2015
|
2014
|
|
Return on investments, %
|
4.9%
|
7.8%
|
|
Real return, %
|
5.1%
|
7.2%
|
|
Return by asset class, %
|
|
Fixed-income investments
|
|
Liquid fixed-income investments
|
0.2%
|
4.9%
|
|
Other fixed-income investments
|
7.1%
|
5.6%
|
|
Equities
|
|
Listed equities
|
10.3%
|
11.7%
|
|
Other equity investments
|
18.6%
|
12.0%
|
|
Other investments
|
|
Real estate funds
|
9.5%
|
10.3%
|
|
Infrastructure funds
|
11.7%
|
3.8%
|
|
Hedge funds
|
2.5%
|
6.0%
|
|
Expenses for investment activities (as % of average capital)
|
0.04%
|
0.04%
|
| |
|
|
|
Average returns
|
5 years
|
10 years
|
|
Average return on portfolio p.a.
|
5.5%
|
4.5%
|
|
Average real return p.a.
|
4.0%
|
2.7%
|
|
Average effective interest rate on government debt p.a.
|
2.1%
|
2.8%
|
|
Portfolio allocation
|
2015
|
2014
|
|
Total investments, EURm
|
17,853.3
|
17,599.9
|
|
Fixed-income investments, %
|
49.0%
|
51.5%
|
|
Liquid fixed-income investments, %
|
47.8%
|
50.7%
|
|
Other fixed-income investments, %
|
1.2%
|
0.8%
|
|
Equity investments, %
|
43.1%
|
42.2%
|
|
Listed equities, %
|
41.0%
|
39.5%
|
|
Other equity investments, %
|
2.1%
|
2.7%
|
|
Other investments, %
|
7.5%
|
6.6%
|
|
Real estate funds, %
|
2.7%
|
2.5%
|
|
Infrastructure funds, %
|
1.6%
|
1.1%
|
|
Hedge funds, %
|
3.1%
|
2.9%
|
|
Other, %
|
0.2%
|
|
|
Key figures (portfolio excl. alternative investments)
|
2015
|
2014
|
|
Volatility
|
8.3%
|
6.1%
|
|
Sharpe ratio
|
0.52
|
1.22
|
The portfolio was reallocated in 2015. The figures are corrected respectively.