VER’s return on investments 0.6% during 1 Jan–31 March 2026; ten-year average annual return 6.1%
Published 2026-04-29 at 11:59
INVESTMENT ENVIRONMENT
From an economic perspective, 2026 began on a largely positive note, as even Europe saw early signs of faster-than-expected economic growth. Contrary to the typical trend of recent years, stocks in the rest of the world outperformed those in the United States in January and February, while the returns on shares of American tech giants lagged behind those of more traditional sectors as investors reassessed the long-term profitability of the investments required for artificial intelligence.
Geopolitical themes played a central role throughout the early part of the year. The ongoing war in Ukraine, speculation about the future of U.S. alliances, and the rapidly escalating conflict in Iran and elsewhere in the Middle East at the end of February have dominated both general news headlines and economic discourse. From the perspective of the global economy, critical issues include the price pressures and supply disruptions resulting from the war, particularly in crude oil and natural gas; however, it is already clear that the hostilities are driving up inflation expectations and slowing economic growth.
As a result of the conflict in Iran, crude oil prices rose rapidly by tens of percent, and stock markets worldwide fell by 10–15 per cent. The market also revised its expectations regarding the near-term trajectory of central bank interest rates. While at the beginning of the year the European Central Bank was expected to keep its key interest rates unchanged and U.S. interest rates were expected to fall during the year, by the end of the quarter it was projected that the ECB would raise its key policy rates three times and that U.S. rates would remain unchanged. When it comes to future central bank decisions and general interest rate trends, what matters — along with the duration of disruptions in oil product supplies and price trends — is the extent to which consumers will be compensated for the price increases.
The stock market has largely recovered from its March lows, reflecting expectations that the situation in Iran will be resolved quickly and without significant long-term consequences for the global economy. If these expectations are met, the conditions for moderate economic growth will remain in place.
VER’S RETURN ON INVESTMENTS
Future monitoring and evaluation of the State Pension Fund’s investment activities will focus on long-term outcomes and future prospects instead of quarterly reporting. However, VER will continue to post quarterly figures and comments.
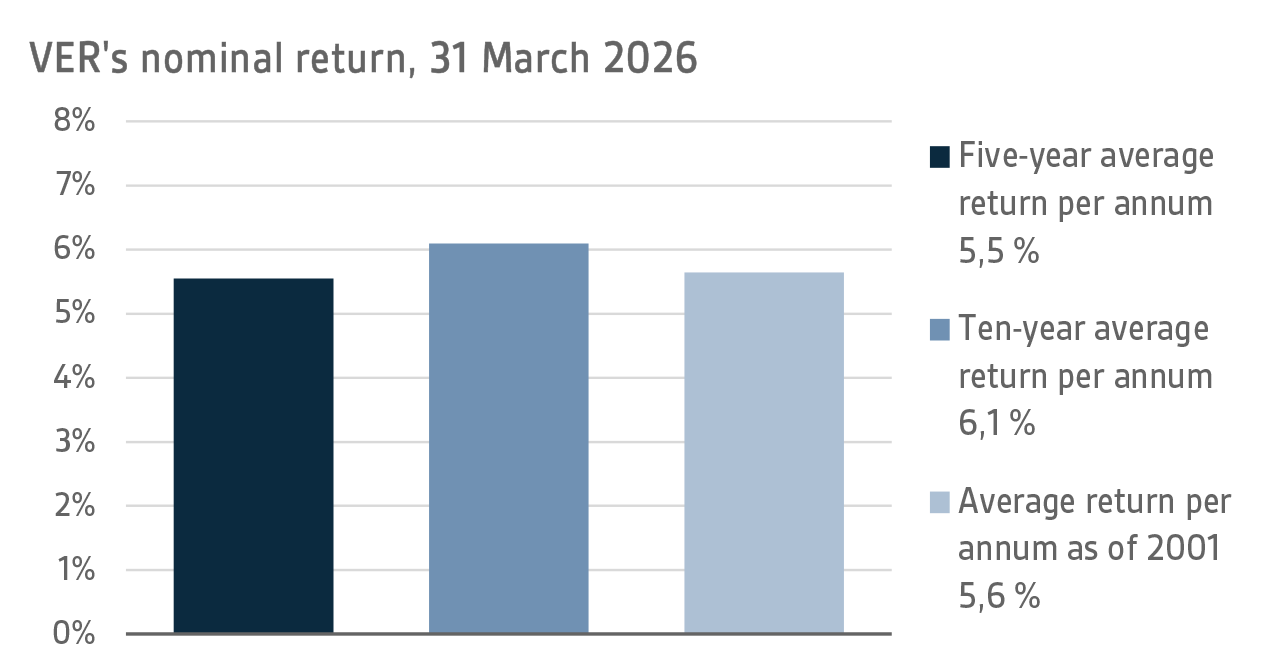
On 31 March 2026, VER’s investment assets totalled EUR 25.7 billion. During the first quarter, the return on investments at fair values was 0.6 per cent. The average nominal rate of return over the past five years (1 April 2021–31 March 2026) was 5.5 per cent and the annual ten-year return 6.1 per cent. Since 2001, when VER’s activities assumed their current form, the average rate of return has been 5.6 per cent.
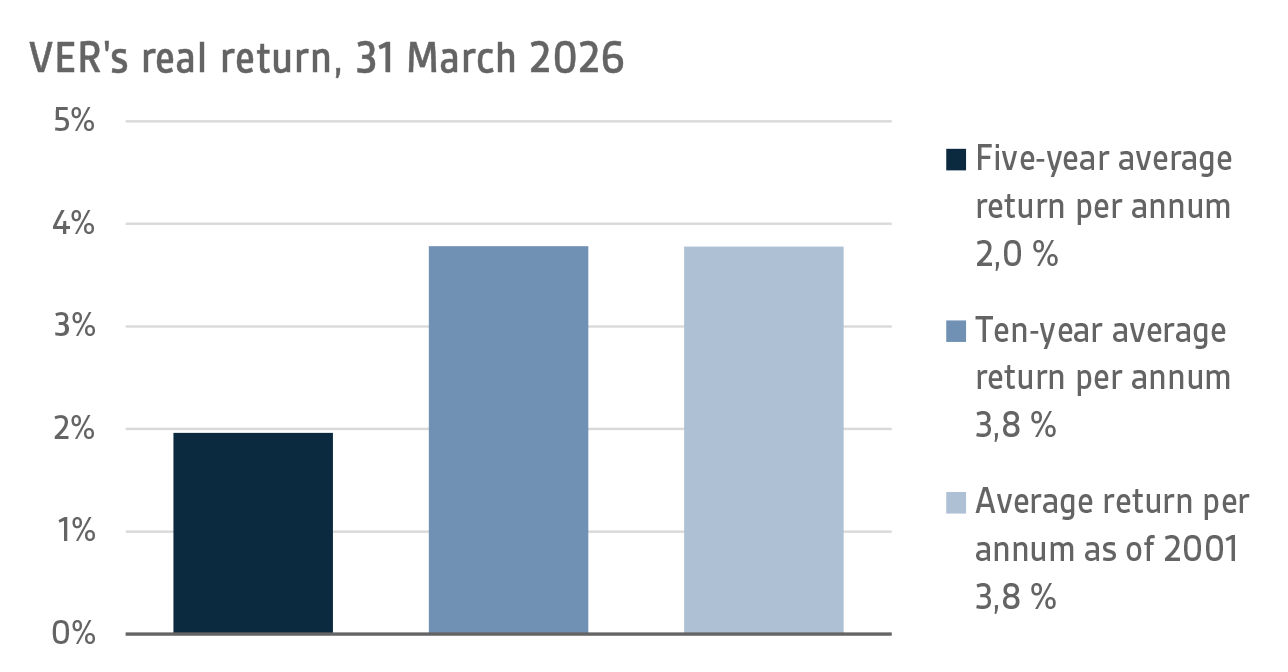
To determine real returns, the Finnish consumer price index has been used as the inflation indicator. The real rate of return during the first quarter was -1.0 per cent. VER’s five-year average real return was 2.0 per cent and ten-year real return 3.8 per cent per year. Since 2001, when VER’s activities assumed their current form, the average real rate of return has been 3.8 per cent.
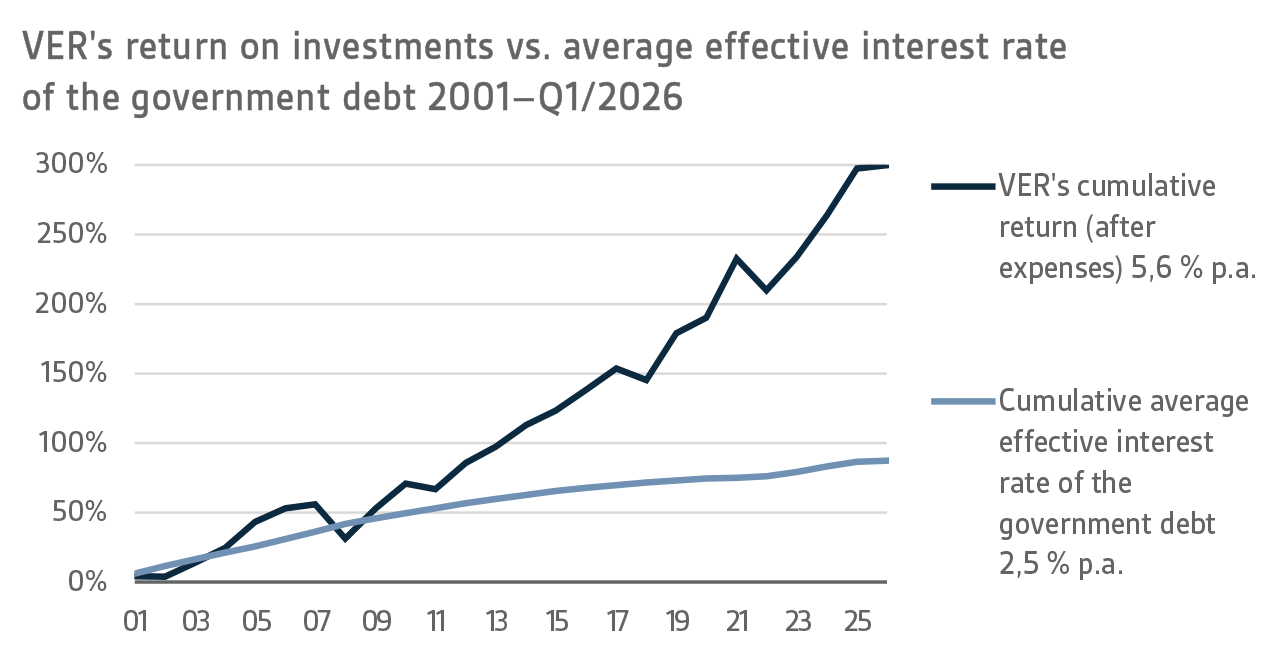
From the State’s point of view, it is pertinent to compare the return on investments with the cost of net government debt, because the funds accumulated in preparation for future pension expenditure can be deemed to reduce such debt. Over the past ten years, VER’s average annual rate of return has beaten the cost of net government debt by 4.9 percentage points. Since 2001, the total market-value returns earned by VER have exceeded the cumulative average cost of equivalent government debt by about EUR 13.6 billion over the same period.
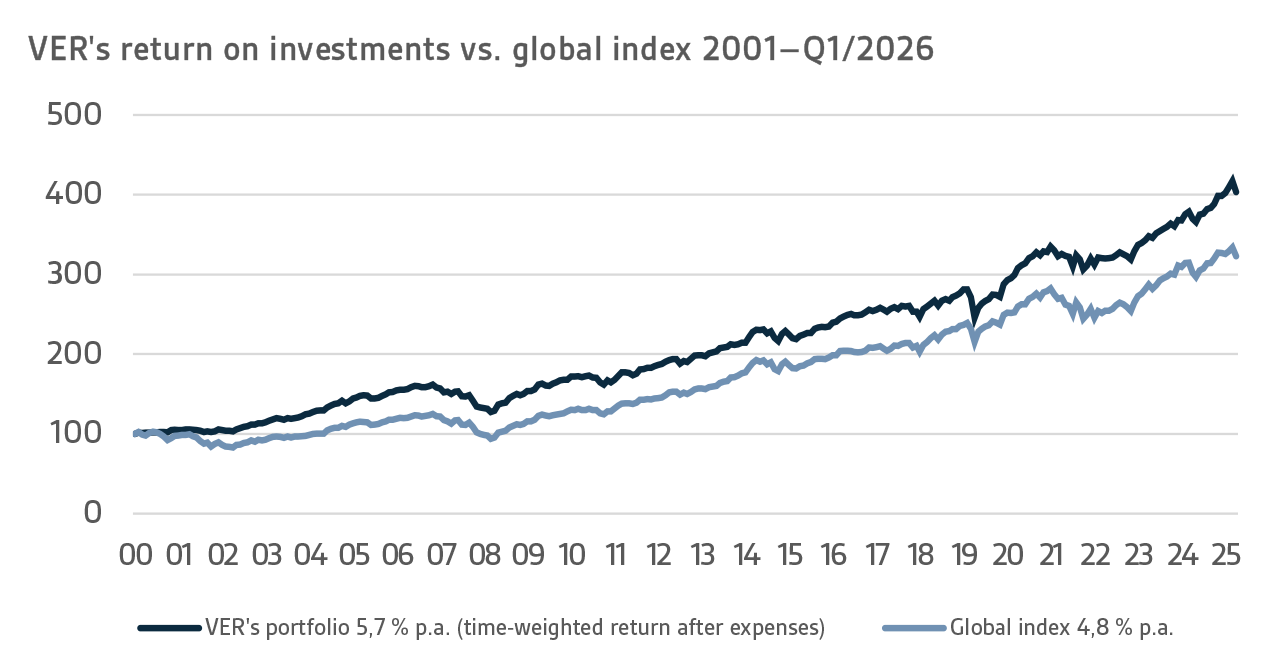
VER monitors long-term return relative to overall market developments by comparing the actual return with a global index, in which the weight of both equities and currency-hedged fixed income instruments is 50 per cent.
A CLOSER LOOK AT JANUARY–MARCH 2026
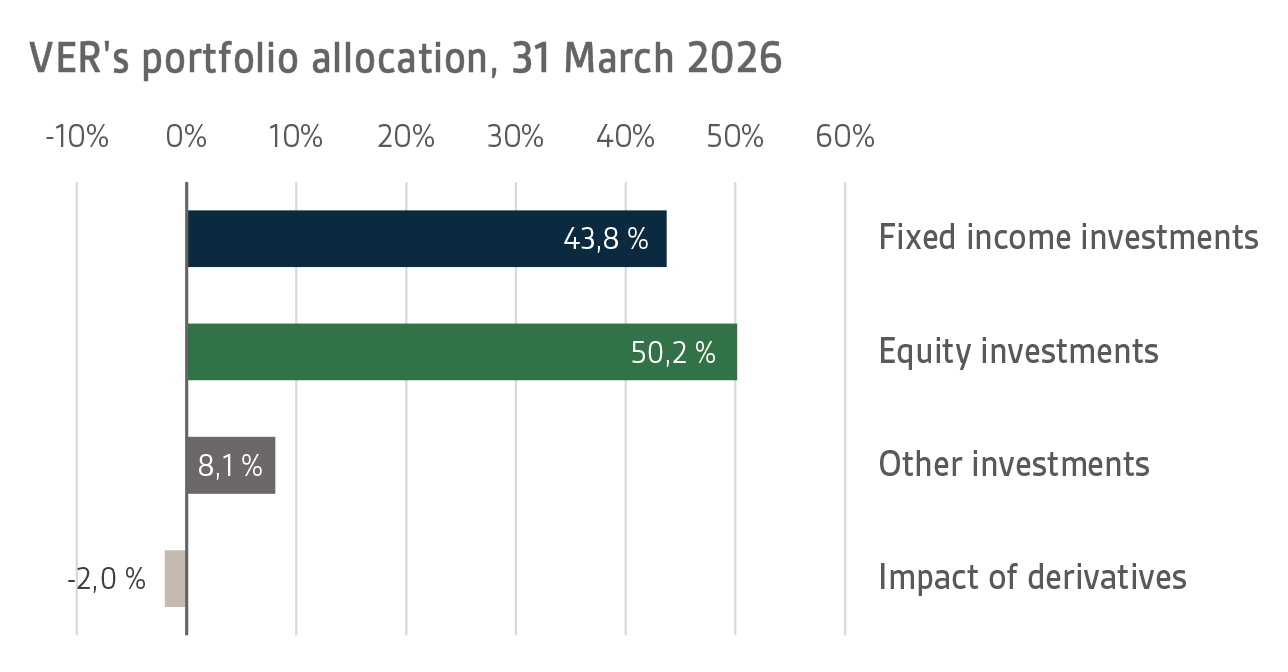
In accordance with the guidelines of the Ministry of Finance, VER’s investments are divided into fixed income instruments, equities and other investments. At the end of March, fixed income instruments accounted for 43.8 per cent, equities 50.2 per cent and other investments 8.1 per cent of the total. Of the large asset classes, liquid fixed income instruments generated a return of -0.5 per cent and listed equities 1.0 per cent during the first quarter of the year.
FIXED INCOME INVESTMENTS
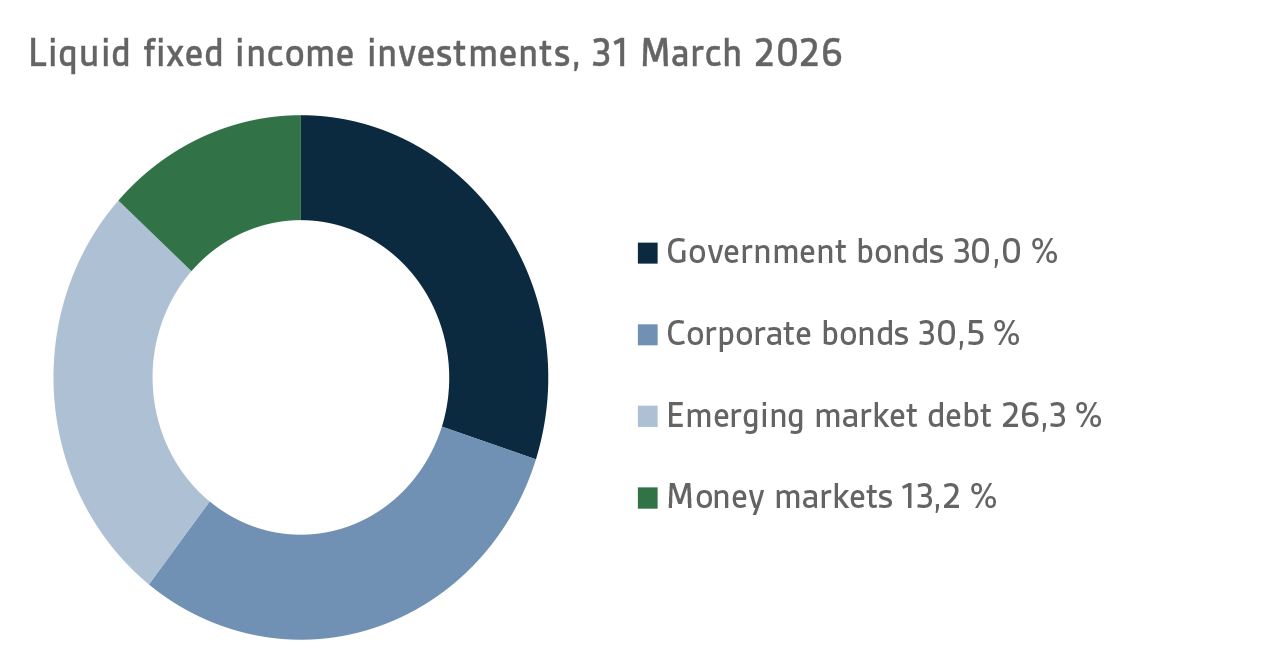
Liquid fixed income investments
During the first quarter, the return on liquid fixed income instruments was -0.5 per cent.
The European Central Bank ECB and the U.S. Federal Reserve FED kept their official interest rates unchanged during the first quarter. However, there was a significant shift in the market pricing of the policy rate path around the turn of February and March, as the conflict in the Middle East escalated. At the beginning of the year, the ECB was expected to keep its key interest rate unchanged, while the FED was believed to cut its corresponding rate twice by at least 25 basis points during 2026. In March, market expectations shifted such that the ECB was foreseen to raise its interest rate by as much as 75 basis points, while the FED was thought to keep its policy rate unchanged throughout 2026.
The adjustment was driven by a significant rise in oil and gas prices and the resulting acceleration in expected inflation. Yield curves flattened as two-year yields rose more than ten-year yields. For central banks, the situation was challenging, with economic growth and inflation outlooks pointing in different directions. Both the ECB and the FED signalled that they would monitor the situation and make decisions based on incoming data.
The Middle East crisis also widened credit spreads on corporate bonds and emerging market bonds, although the market movement was smaller than, for example, the move seen in early April 2025 on ‘Liberation Day’. The rise in underlying interest rates, combined with widening risk premiums, pushed returns on these fixed income asset classes to zero or into negative territory, despite, for example, very strong performance in local-currency investments in emerging markets during the first two months of the year.
In VER’s liquid fixed income investments, returns on money market and government bond investments were positive, while returns on riskier corporate bond and emerging market investments turned negative.
Other fixed income investments
Other fixed income investments include investments in private credit funds and direct lending to companies.
During the first quarter of 2026, the return on other liquid fixed income instruments was 1.0 per cent. Private credit funds returned 0.7 per cent and direct lending 2.5 per cent.
Over the spring, there has been a lively debate surrounding the private credit market. Some of the reporting has been misleading and has conflated the traditional private credit market with,
inter alia
, the listed BDC credit market favoured by private investors in the United States. Redemptions from BDC funds surged as investors grew concerned about the uncertain future prospects of the funds’ loans to software companies.
The investments in VER’s portfolio are focused on strategies that have been largely unaffected by the recent discussions. The portfolio situation is quite stable, although the relatively low volume of LBO transactions in the first few months of the year adds to the uncertainty surrounding the current year. The amount of uncommitted capital in private equity funds remains high, so the LBO market is expected to pick up during the current year, creating good investment opportunities, particularly for direct lending managers.
EQUITIES
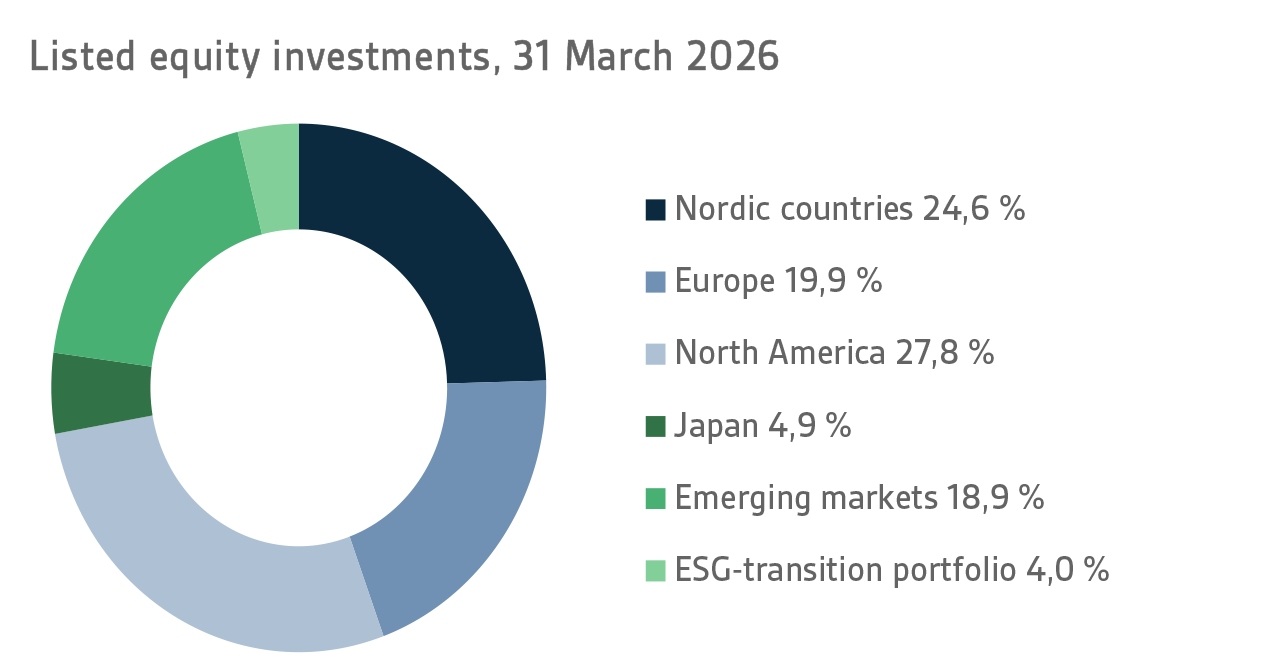
Listed equities
At the end of the reporting period, the return on listed equities was 1.0 per cent.
For investors, the first quarter of 2026 was a mixed bag. The year got off to a brisk start with a broad-based rally in the stock markets, while emerging markets, and the Japanese stock market, in particular, performed exceptionally well in January and February. The rise in the stock markets was driven, among other things, by signs that global growth was picking up. In contrast to the strongly technology-driven environment of recent years, gains were seen across a wide range of sectors on stock markets around the world. U.S. stock exchanges experienced a fairly sharp sector rotation, as technology companies — which had performed exceptionally well in recent years — lagged behind other companies in terms of returns.
Geopolitical tensions continued to persist in the early part of the year. In particular, President Trump’s speech at the World Economic Forum (WEF) in Davos, Switzerland, caused considerable uncertainty regarding the current state of Western alliances. The reaction in the financial markets was fairly muted, and the situation quickly calmed down. However, the war in Iran, which began during the last weekend of February, completely changed the situation. Hopes that the conflict would be short-lived quickly faded, and, driven in part by rising oil prices, global stock markets saw sharp percentage declines during March. Intraday volatility was extremely high in both directions throughout March, as the stock markets reacted promptly to the latest news, often delivered via President Trump’s social media posts. At the end of the first quarter, the situation remained highly uncertain, and it is very difficult to assess the long-term impact of the ongoing conflict on the longer-term earnings forecasts of publicly traded companies.
The returns on all listed stock portfolios were very close to zero at the end of the first quarter. Investments in the Japanese and emerging markets stock markets performed the best. The weakest performance was put in by investments in North America and Europe, with returns remaining in negative territory at the end of the first quarter.
Other equity investments
VER’s other equity investments include investments in private equity funds, infrastructure and unlisted stock.
Private equity
investments returned 2.1 per cent, infrastructure funds 1.7 per cent and unlisted equities 6.4 per cent during the first quarter.
The final quarter of 2025 showed signs of a recovery in the private equity transaction market. This created positive expectations for the current year. Even so, the first quarter was still fairly quiet. However, since holding periods for portfolio companies in private equity funds are now at record highs and there is also a significant amount of uncalled capital in the funds, the transaction market is expected to pick up during the rest of the year after the lull of recent years.
As with other illiquid asset classes, the first quarter returns for infrastructure funds consist of updated returns from the last quarter of the previous year, and therefore do not yet reflect the situation in 2026. Expectations for the coming year are cautiously optimistic, even though concerns stemming from the war in Iran are also affecting the inflation-hedging asset class. Investor interest in infrastructure investments remains strong, and funds have indeed been able to raise capital more easily than other illiquid asset classes.
OTHER INVESTMENTS
VER’s other investments include investments in real estate investment trusts, hedge funds and systematic strategies.
During the first quarters of 2026, the return on unlisted real estate investment trusts was 0.1 per cent.
In the real estate sector, market sentiment shifted from negative to cautiously optimistic in 2025 after several years of decline. The fall in interest rates that began in 2024 and the sharp drop in property values supported positive expectations. The current year is overshadowed by the war in Iran, which is feared to trigger another rise in interest rates and increase uncertainty in the real estate market. So far,
the impact has been minimal, and the optimistic mood persisted throughout the first quarter.
Hedge funds and derivative strategies for position management returned 1.1 per cent in January–March.
Hedge fund returns started the year strongly, as in previous years, but the market turbulence caused by the conflict in the Middle East in March significantly weighed on overall first-quarter returns. It was a particularly challenging period for the portfolio’s macro funds, which were burdened by rapid and sharp movements in the interest rate and commodity markets. During the reporting period, the top performers in the portfolio were quantitative strategies and trend-following CTA strategies.
STATE PENSION EXPENDITURE, VER’S TRANSFERS TO THE GOVERNMENT BUDGET, PENSION CONTRIBUTION INCOME AND RISK LEVEL
The role of the State Pension Fund in equalising the government’s pension expenditure continues to grow. In 2025, the State’s pension expenditure totalled over EUR 5.6 billion while the 2026 budget foresees an expenditure of nearly EUR 5.6 billion. VER contributes 44.2 per cent, or EUR 2.5 billion, towards these expenses to the 2026 government budget.
By the end of March, VER had transferred EUR 0.6 billion to the government budget. Over the same period, VER’s pension contribution income totalled EUR 0.4 billion. The pension contribution income matches the forecast. VER’s net pension contribution income has now turned permanently negative, meaning that clearly more money is transferred from VER to the government budget than VER receives in pension contribution income. According to current estimates, this gap between budget transfers and income will continue to grow up to the mid-2030s, which will slow down the growth of the Fund and the improvement of the funding ratio. The negative cash flow is expected to continue until the 2050s.
The Act on the State Pension Fund was amended in spring 2025. At the Government’s 2025 mid-term economic policy review, it was proposed that the budget transfer be increased by 1.2 percentage points so that in 2028 the transfer would be 46.2 per cent of pension expenditure. Additionally, the Government proposed that the budget transfer for 2027 be increased on a one-off basis to reach 63.9 per cent of the state's annual pension expenditure. These amendments were signed into law effective as of 1 January 2026. In addition to the above-mentioned increases, the 2025 autumn budget session proposed a permanent increase in the budget transfer, which is estimated at 1.8 percentage points from 2027 onwards. Following the legislative amendment effective as of 2026 and the budget proposal, the budget transfer, relative to state pension expenditure, will be 44.2 per cent in 2026, 65.7 per cent in 2027, and 48 per cent from 2028 onwards. If the funding ratio exceeds 25 per cent for two consecutive calendar years, an additional transfer of three percentage points will be made to the government budget.
According to VER’s assessment, as a result of the budget transfers that have been decided and proposed, VER’s risk level will be lower than previously planned, which will have a negative impact on the fund’s expected returns. The aim is to set the risk level of VER’s investments in such a way that budget transfers can continue to be secured with a high degree of probability.
|
KEY FIGURES
|
|
|
|
|
31.3.2026
|
31.12.2025
|
31.3.2025
|
|
Investments, MEUR (market value)
|
25 678
|
25 760
|
24 186
|
|
Fixed income investments
|
11 235
|
10 110
|
9 531
|
|
Equity investments
|
12 880
|
14 330
|
13 152
|
|
Other investments
|
2 073
|
2 045
|
1 950
|
|
Impact of derivatives
|
-510
|
-725
|
-447
|
|
|
|
|
|
Breakdown of the investment portfolio
|
|
|
|
|
Fixed income investments
|
43,8 %
|
39,2 %
|
39,4 %
|
|
Equity investments
|
50,2 %
|
55,6 %
|
54,4 %
|
|
Other investments
|
8,1 %
|
7,9 %
|
8,1 %
|
|
Impact of derivatives
|
-2,0 %
|
-2,8 %
|
-1,8 %
|
|
|
|
|
|
1.1.-
31.3.2026
|
1.1.-
31.12.2025
|
1.1.-
31.3.2025
|
|
Return on investment
|
0,6 %
|
9,3 %
|
0,6 %
|
|
Fixed income investments
|
|
|
|
|
Liquid fixed income investments
|
-0,5 %
|
4,3 %
|
0,7 %
|
|
Private Credit funds
|
0,7 %
|
4,8 %
|
0,3 %
|
|
Direct lending
|
2,5 %
|
2,5 %
|
-0,5 %
|
|
Equity investments
|
|
|
|
|
Listed equity investments
|
1,0 %
|
15,4 %
|
-0,3 %
|
|
Private Equity investments
|
2,1 %
|
2,8 %
|
2,4 %
|
|
Infrastructure funds
|
1,7 %
|
5,7 %
|
-0,5 %
|
|
Unlisted equity investments
|
6,4 %
|
28,6 %
|
22,8 %
|
|
Other investments
|
|
|
|
|
Unlisted Real Estate funds
|
0,1 %
|
0,1 %
|
-0,8 %
|
|
Hedge funds and systematic strategies
|
1,1 %
|
11,3 %
|
1,7 %
|
|
|
|
|
|
Pension contribution income, MEUR
|
389
|
1 656
|
389
|
|
Transfer to state budget, MEUR
|
624
|
2 350
|
589
|
|
Net contribution income, MEUR
|
-235
|
-695
|
-200
|
|
Pension liability, BnEUR
|
|
98
|
|
|
Funding ratio, %
|
|
26,5 %
|
|
|
Additional information: Additional information is provided by Chief Executive Officer Antti Suhonen, firstname.lastname@ver.fi, tel. 0295 201 229
Established in 1990, the State Pension Fund (VER) is an off-budget fund through which the State prepares to finance future pensions and equalise pension expenditure. VER is an investment organisation responsible for investing the State’s pension assets professionally. At the end of March 2026, the market value of the Fund’s investment portfolio stood at EUR 25.7 billion.
All figures presented in this interim report are preliminary and unaudited.