VER’s return on investment 3.0% during 1 Jan–31 March 2024; ten-year average annual return 5.5%
Published 2024-04-24 at 13:36
INVESTMENT ENVIRONMENT
The investment environment was favourable during the first quarter of 2024. Stock markets continued to perform strongly despite the fact that short-term interest rates remained high. The sound return on equities was a key factor contributing to VER's 3.0% return on investments during the period.
Inflation abated as expected. Experts expect inflation in the euro area and the United States to approach the central banks' 2% target towards the end of the year or early next year at the latest. However, investors feel that the inflation developments may still harbour risks and surprises.
Although the central banks’ interest rate policy has so far been tight, monetary policy is expected to relax over the course of the year. Central bank policy rates are predicted to fall as of the summer in both the euro area and the United States. The timing and pace of interest rate cuts has been an intervening variable during the early part of the year and highly important for investors. However, economic growth and foreseen corporate earnings have been a stronger driver, which has kept stock prices at a sound level. At the moment, few people expect a downturn to lead to a recession in the United States. In the euro area, economic development has been uneven and, in several countries, extremely modest, if not non-existent.
Geopolitical tensions persist. Russia’s war of aggression and the conflict in Gaza have continued to create uncertainty. While the situation between China and Taiwan has remained unchanged, many fear that tension will increase. Hybrid influencing and cyber-attacks are ever-present and expected to intensify further. Geopolitical uncertainty appears to be here to stay with no easy solution in sight. The global division into camps seems to continue.
VER’S RETURN ON INVESTMENTS
Future monitoring and evaluation of the VER’s investment activities will focus on long-term outcomes and future prospects instead of quarterly reporting. However, VER will continue to post quarterly figures and comments.
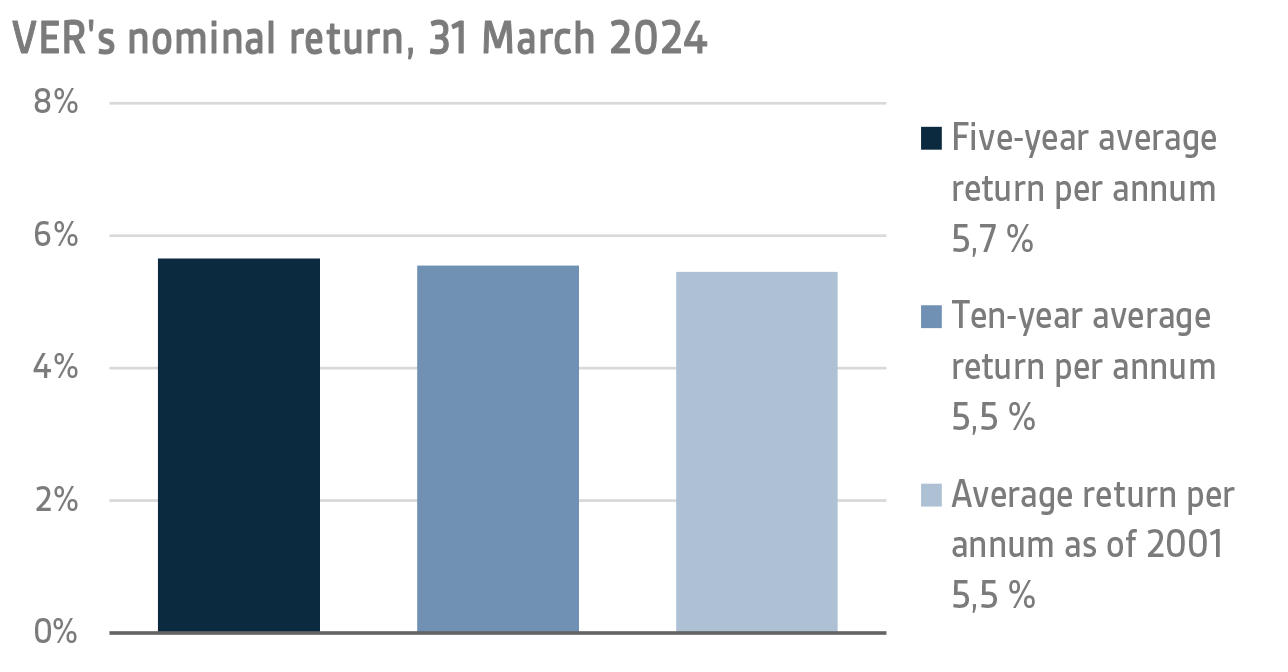
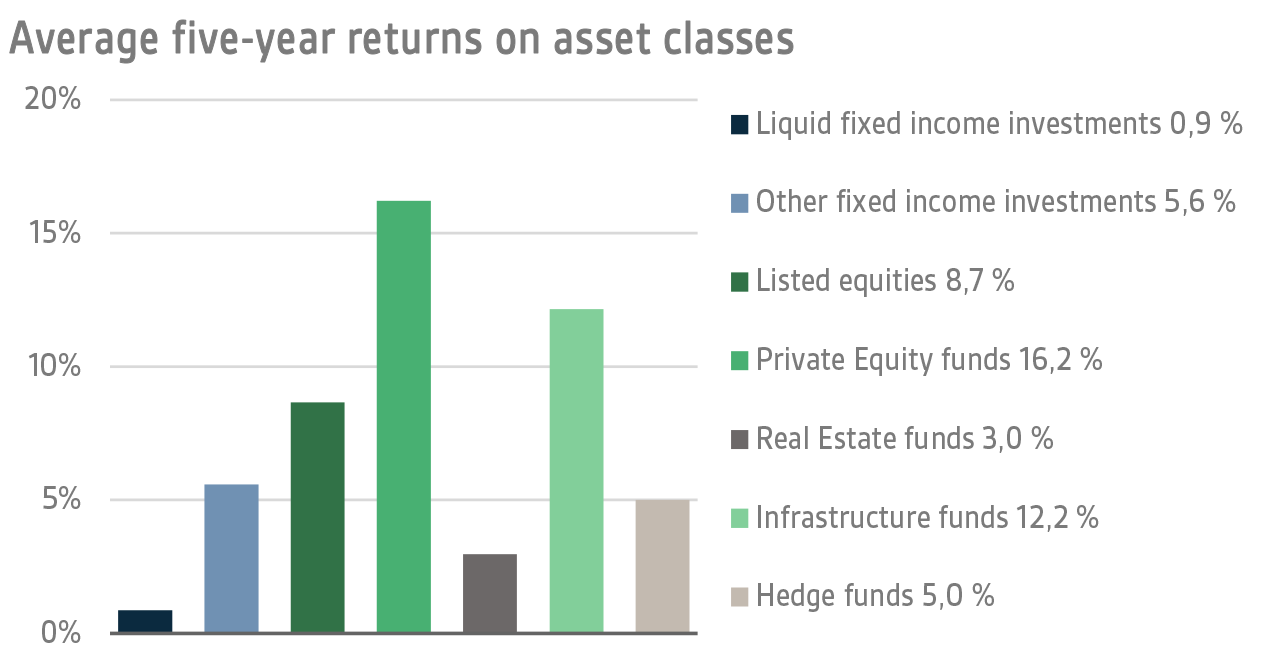
On 31 March 2024, VER’s investment assets totalled EUR 23.3 billion. During the first quarter, the return on investments at fair values was 3.0 per cent. The average nominal rate of return over the past five years (1 March 2019–31 March 2024) was 5.7 per cent and the annual ten-year return 5.5 per cent. Since 2001 when VER’s activities assumed their current form, the average rate of return has been 5.5 per cent.
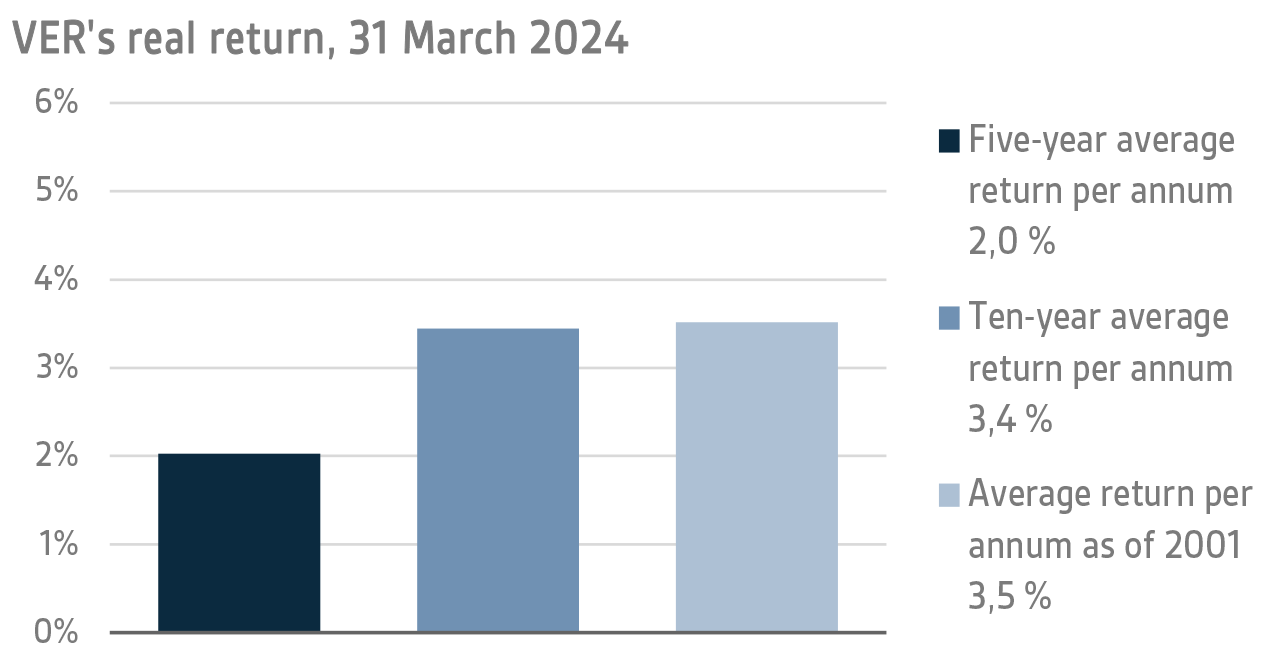
The real rate of return during the first quarter of 2024 was 2.2 per cent. VER’s five-year average real return was 2.0 per cent and ten-year real return 3.4 per cent. Since 2001, when VER’s activities assumed their current form, the average real rate of return has been 3.5 per cent.
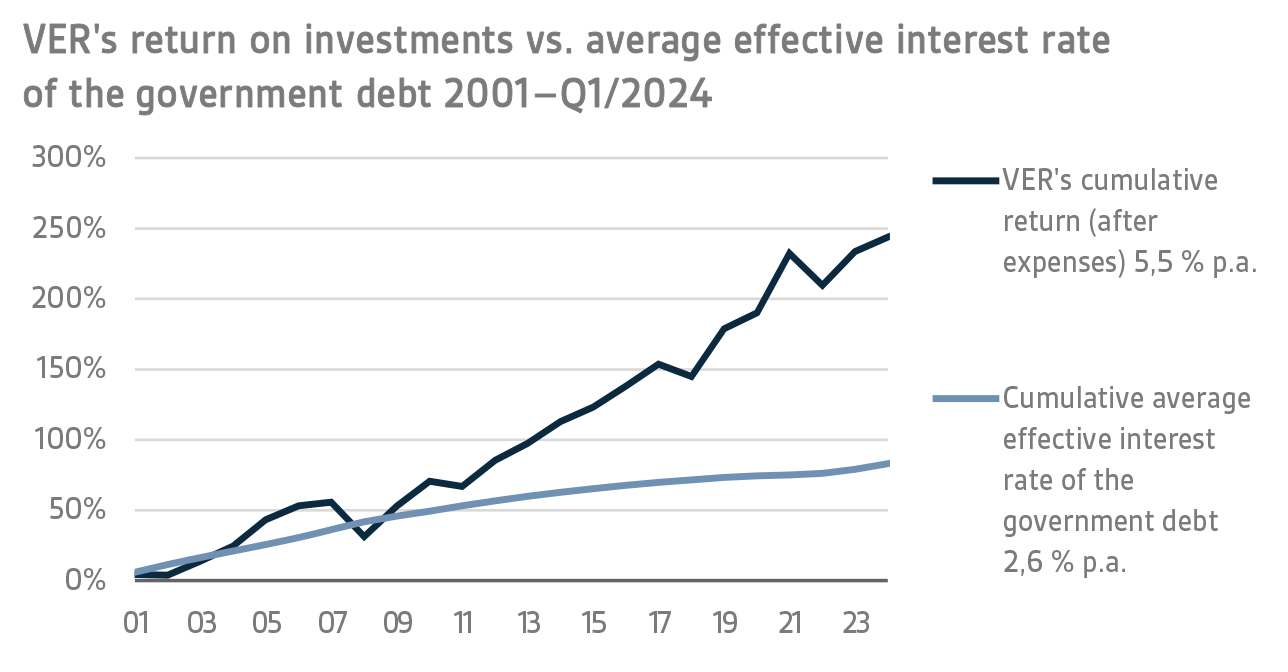
From the State’s point of view, it is pertinent to compare the return on investments with the cost of net government debt, because the funds accumulated in preparation for future pension expenditure can be deemed to reduce such debt. Over the past ten years, VER’s average annual rate of return has beaten the cost of net government debt by 4.3 percentage points. Since 2001, the total market-value returns earned by VER have exceeded the cumulative average cost of equivalent government debt by about EUR 10.8 billion over the same period.
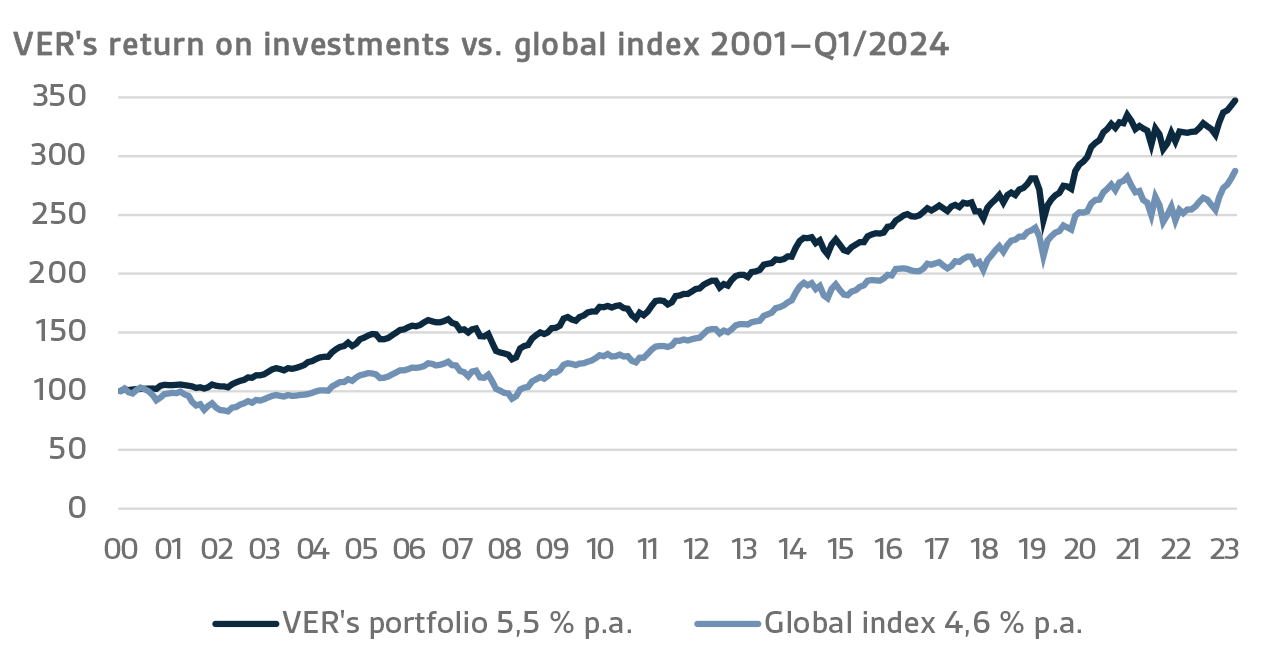
VER monitors long-term return relative to overall market developments by comparing the actual return with a global index, in which the weight of both equities and currency-hedged fixed income instruments is 50 per cent.
A CLOSER LOOK AT JANUARY–MARCH 2024
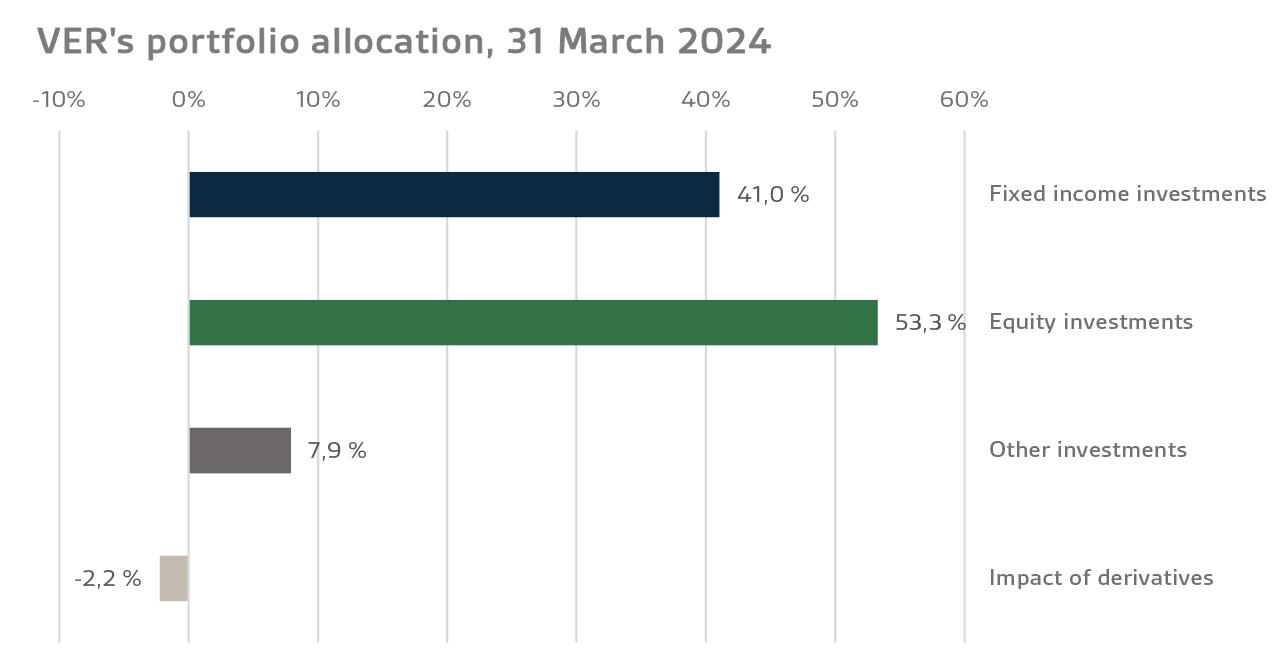
In accordance with the directive of the Ministry of Finance, VER’s investments are divided into fixed income instruments, equities and other investments. At the end of March, fixed income instruments accounted for 41.0 per cent, equities 53.3 per cent and other investments 7.9 per cent of the total. Of the large asset classes, liquid fixed income instruments generated a return of 0.6 per cent and listed equities 6.6 per cent during the first quarter of the year.
FIXED INCOME INVESTMENTS
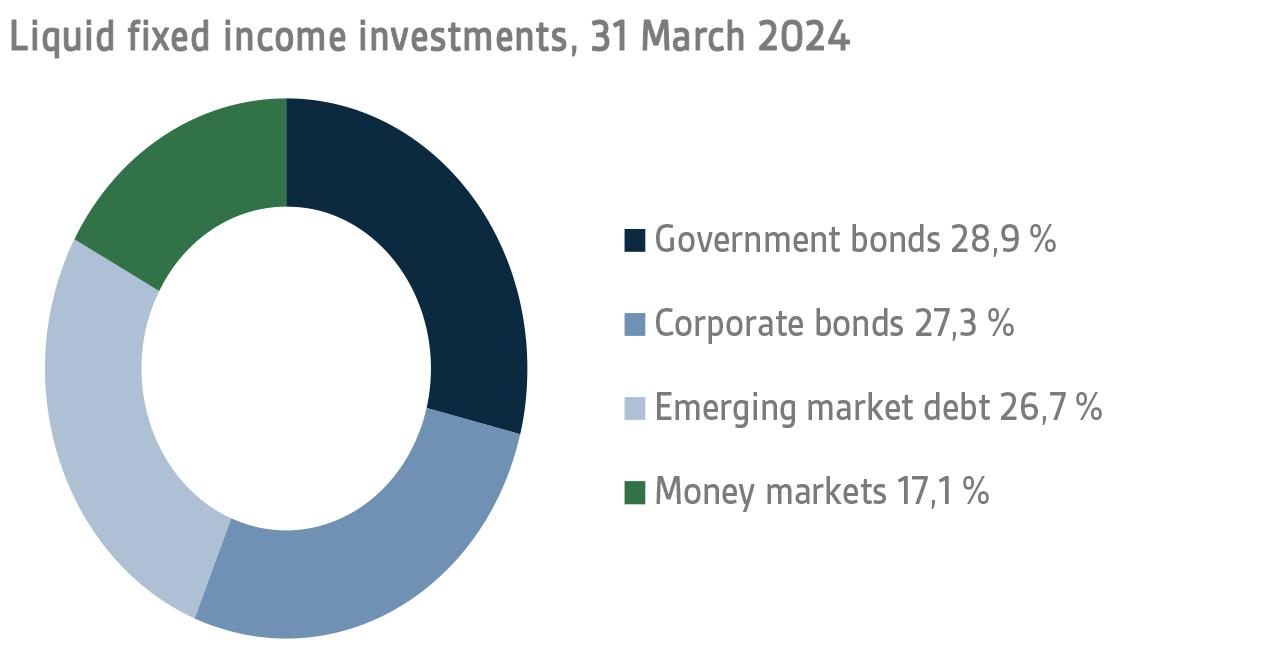
Liquid fixed income investments
During the first quarter, the return on liquid fixed income instruments was 0.6 per cent.
In the first quarter of the year, both the US Federal Reserve (FED) and the European Central Bank (ECB) signalled that the timing of interest rate cuts would depend on future economic and inflation developments, and the central banks did not change their stance from that outlined at their December meetings. As a result, government bond rates in particular rose sharply as interest rate expectations in the market moved closer to the path set by central banks.
The FED rate meeting in December signalled a 0.75 percentage point rate cut for 2024, but interest rate markets were already pricing in rate cuts of around 1.50 percentage points. However, the inflation figures published in the first quarter were slightly higher than expected, whereas the indicators for the US economy were surprisingly positive. The market expectations regarding rate cuts were re-adjusted. At the end of March, the first rate cut was expected to take place in June or July while policy rates were foreseen to fall by a total of around 75 basis points during 2024.
The ECB lowered its inflation forecasts at its March meeting, which was taken to mean that interest rate cuts were to commence soon. However, the meeting stressed the need for more information for assessing inflation developments, particularly regarding the impact of wages on inflation. Markets were pricing in ECB rate cuts as of June, foreseeing four rate cuts of 25 basis points for the entire year.
Despite the rise in interest rates, risk premiums on corporate bonds and emerging market debt continued to fall, a trend that had started in late 2023, driven by stronger-than-expected economic statistics and a robust equity market.
Of VER's liquid fixed income investments, the best returns were generated by higher-risk instruments, such as the investments in emerging market debt and lower-rated corporate bonds.
Other fixed income investments
Other fixed income investments include investments in private credit funds and direct lending to companies.
The return on other fixed income investments was 0.5 per cent. Private credit funds returned 0.3 per cent and direct lending 1.2 per cent.
The return outlook for private credit funds issuing floating rate loans changed substantially as a result of the rise in interest rates. At the same time, the role of banks in financing,
inter alia
, LBO transactions declined significantly, increasing the demand for private money, especially in Europe. However, rising financing costs are feared to have a negative impact on companies' performance in the coming years, leading to an increase in payment defaults. So far, the market situation has been relatively calm and no major problems have been experienced in VER's private credit portfolio. The returns generated in the first quarter of the current year still reflect the sentiment prevailing at the end of the previous year, as most of the portfolio's return is based on updated year-end returns.
EQUITIES
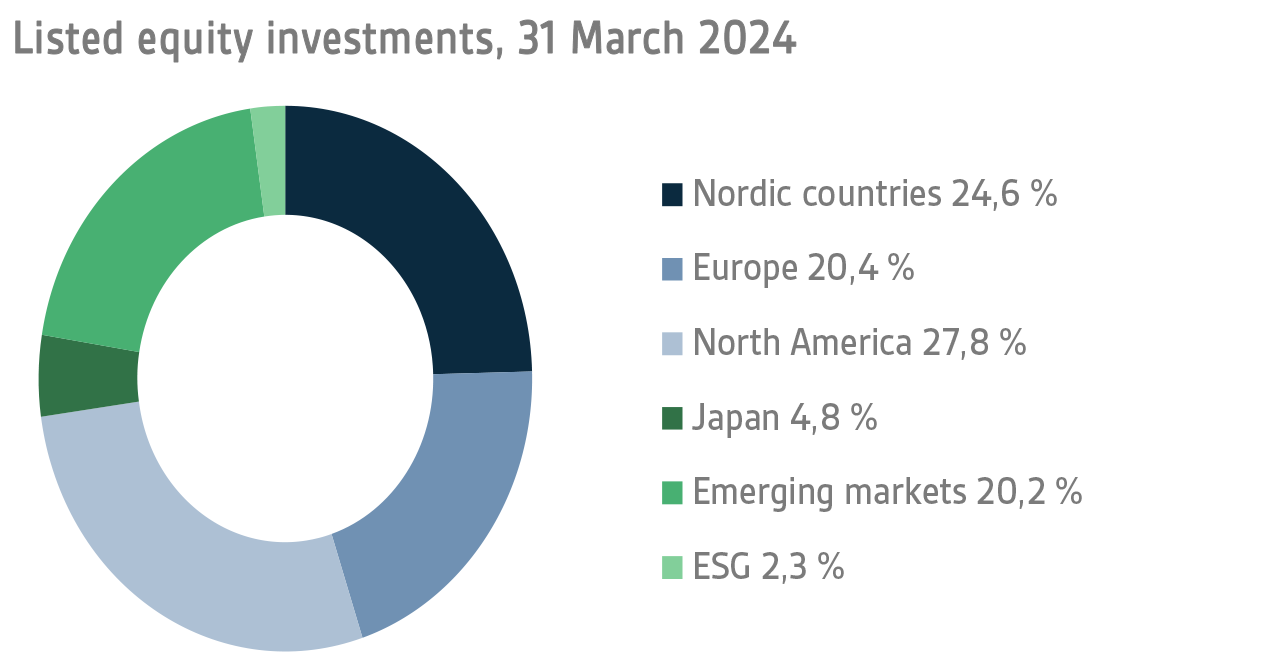
Listed equities
The return on listed equities during the first quarter was 6.6 per cent.
The mood in the equity market during the first quarter of 2024 was mostly positive. The strong rise in stock markets that started in the last week of October 2023 continued in the current year. The equities continued to do well even though interest rates kept rising for most of the time during Q1, mainly due to the persistently high inflation. Q1 macro data from the US showed that the economy and consumption remained at a sound level, which contributed to the upbeat mood in equity markets. Even though macroeconomic performance in Europe was weaker than in the United States, European equities also performed well during the quarter, with the exception of Finnish equities, whose quarterly returns remained weak, partly due to the problems faced by exporters. The best performance in the quarter was put in by Japanese equity markets, where a long-term local bull market pushed indexes to levels last seen in the early 1990s.
With the rise of the stock market, valuation multiples increased, especially in the United States. It should be noted that it has been US companies that have been benefitting most from the ongoing robust AI boom. For many of these companies, earnings growth expectations are extremely high, and it remains to be seen how they will be able to meet these expectations in the coming years. Aside from US companies, valuation multiples look moderate, especially in Europe, even though positive earnings growth is foreseen for listed European companies as well.
Other equity investments
VER’s other equity investments include investments in private equity funds, infrastructure and unlisted stock.
Private equity investments returned 2.8 per cent, infrastructure funds 1.6 per cent and unlisted equities -8.6 per cent.
At the beginning of the year, the mood in the private equity market was expectant. The transaction market is expected to pick up again after a quiet period of 12–18 months. As the negative impact of rising interest rates on corporate valuations has remained relatively limited, it should encourage fund exits and new investments. Similarly, the expected fall in interest rates is likely to contribute to a recovery of the transaction market. Although a number of successful exits were accomplished in VER’s portfolio during the first few months of the year, things have not yet been restored to the levels prevailing a few years ago. As in the past, the first-quarter returns on private equity funds are based on the updated values of the returns actually earned in the last quarter of the previous year.
Similarly, the first-quarter returns on infrastructure funds represent updated returns actually earned in the last quarter of the previous year. Although rising interest rates have had a negative impact on infrastructure investments, they have served as quite efficient inflation hedges in the current market environment. Valuation levels have remained high, which will impact the returns on future transactions.
OTHER INVESTMENTS
VER’s other investments include investments in real estate investment trusts, hedge funds and systematic strategies.
The return on investments in unlisted real estate funds was -4.7 per cent.
The negative effects of rising interest rates on the real estate market were still visible in the first quarter of 2024 as the values are based on last year's valuations. However, the market expects property values to have bottomed out and expectations for the rest of the year are cautiously optimistic. Expectations of falling interest rates have also had a positive impact on market sentiment.
Hedge funds and systematic strategies returned 3.6 per cent in the first quarter.
Almost all of VER's hedge fund styles performed well in the first quarter. The period was also favourable for funds focusing on Asian markets, which generated only modest returns in the previous year. An exceptionally good performance was put in by funds focusing on quantitative strategies. The most modest returns were achieved by macro funds, which found it hard to position themselves, especially in the fixed income market.
STATE PENSION EXPENDITURE, VER’S TRANSFERS TO THE GOVERNMENT BUDGET, PENSION CONTRIBUTION INCOME AND FUNDING RATIO
The role of the State Pension Fund in equalising the government’s pension expenditure continues to grow. In 2023, the State’s pension expenditure totalled over EUR 5.3 billion while the 2024 budget foresees an expenditure of nearly EUR 5.6 billion. As VER contributes 41 per cent towards these expenses to the government budget, the transfer to the 2024 budget will amount to over EUR 2.3 billion.
During the first quarter, VER transferred EUR 572 million to the government budget. Over the same period, VER’s pension contribution income totalled EUR 402 million. The pension contribution income matches the forecast. VER’s net pension contribution income has now turned permanently negative, meaning that clearly more money is transferred from VER to the government budget than VER receives in pension contribution income. According to current estimates, this gap between income and budget transfers will continue to grow up to the mid-2030s, which will slow down the growth of the Fund. The negative cash flow is expected to continue until the 2050s.
The Act on the State Pension Fund was amended in spring 2022. As part of this amendment, VER’s contribution to the government budget was increased as of 2024. Consequently, VER’s budget transfers will be gradually increased from the current 41 per cent to 45 per cent during 2024–2028. If the funding ratio exceeds 25 per cent for two consecutive calendar years, an additional transfer of three percentage points will be made to the government budget.
Given VER’s growing role in offsetting government pension expenditure and the increase in negative net transfers, VER’s funding ratio is expected to fall in the coming years.
|
KEY FIGURES
|
|
|
|
|
31.3.2024
|
31.12.2023
|
31.3.2023
|
|
Investments, MEUR (market value)
|
23 324
|
22 803
|
21 936
|
|
Fixed income investments
|
9 573
|
9 180
|
8 827
|
|
Equity investments
|
12 428
|
12 150
|
11 359
|
|
Other investments
|
1 845
|
1 824
|
1 867
|
|
Impact of derivatives
|
-522
|
-351
|
-117
|
|
|
|
|
|
Breakdown of the investment portfolio
|
|
|
|
|
Fixed income investments
|
41,0 %
|
40,3 %
|
40,2 %
|
|
Equity investments
|
53,3 %
|
53,3 %
|
51,8 %
|
|
Other investments
|
7,9 %
|
8,0 %
|
8,5 %
|
|
Impact of derivatives
|
-2,2 %
|
-1,5 %
|
-0,5 %
|
|
|
|
|
|
|
1.1.–31.3.2024
|
1.1.-31.12.2023
|
1.1.–31.3.2023
|
|
Return on investment
|
3,0 %
|
7,7 %
|
2,2 %
|
|
Fixed income investments
|
|
|
|
|
Liquid fixed income investments
|
0,6 %
|
6,9 %
|
1,7 %
|
|
Private Credit funds
|
0,3 %
|
8,5 %
|
-0,6 %
|
|
Direct lending
|
1,2 %
|
4,9 %
|
1,2 %
|
|
Equity investments
|
|
|
|
|
Listed equity investments
|
6,6 %
|
11,3 %
|
4,1 %
|
|
Private Equity investments
|
2,8 %
|
5,0 %
|
0,1 %
|
|
Infrastructure funds
|
1,6 %
|
6,8 %
|
0,1 %
|
|
Unlisted equity investments
|
-8,6 %
|
6,0 %
|
4,1 %
|
|
Other investments
|
|
|
|
|
Unlisted Real Estate funds
|
-4,7 %
|
-6,8 %
|
-1,8 %
|
|
Hedge funds and systematic strategies
|
3,6 %
|
3,2 %
|
-0,4 %
|
|
|
|
|
|
Pension contribution income, MEUR
|
402
|
1 679
|
384
|
|
Transfer to state budget, MEUR
|
572
|
2 116
|
532
|
|
Net contribution income, MEUR
|
-169
|
-437
|
-148
|
|
Pension liability, BnEUR
|
|
101
|
|
|
Funding ratio, %
|
|
22,7 %
|
|
Additional information: CEO Timo Löyttyniemi, firstname.lastname@ver.fi, tel.: +358 (0)295 201 210
Established in 1990, the State Pension Fund of Finland (VER) is an off-budget fund through which the State prepares to finance future pensions and equalise pension expenditure. VER is an investment organisation responsible for investing the State’s pension assets professionally. At the end of March 2024, the market value of the Fund’s investment portfolio stood at EUR 23.3 billion.
All figures presented in this interim report are preliminary and unaudited.